
一個在獲得肺腺癌末期患者頭銜後更加迷茫的大叔
Clap Count Analysis of Irresponsible Matt City
🟥Foreword
First of all, I have to praise @catding for making a matters dashboard , otherwise the uncle who can't play API will not know where to get the data for analysis. By the way, I will provide the information download method that I just discovered to the citizens who don't know it yet:
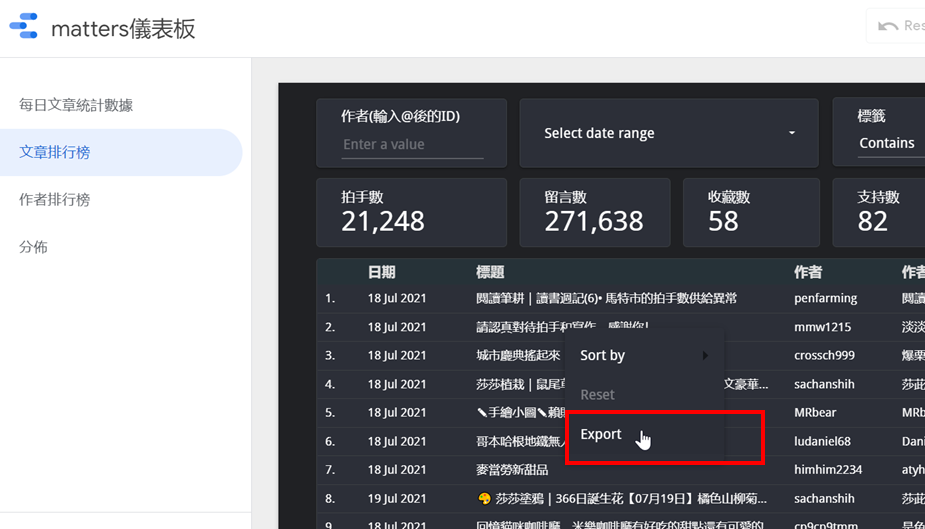
1. Right-click anywhere in the article list, and click "Export".
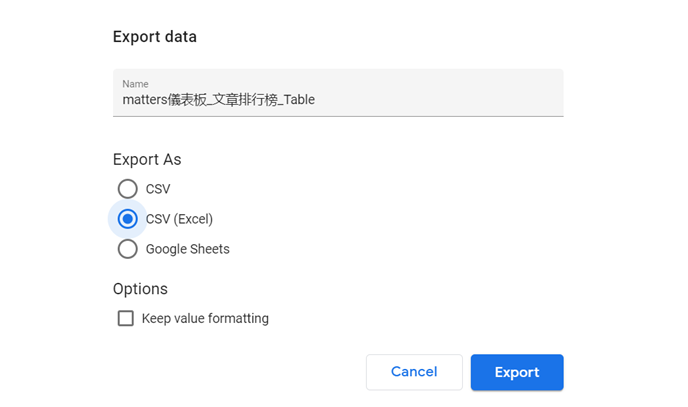
2. Select the desired format and click "Export".
🟥 Data range
The information used is from January 1st to July 15th, 2021. Why not get the 18th? Since the clap count provided by the matter dashboard is the latest number at the moment, I assume that the clap count will slowly decrease a few days after the article is published, so the article 4 days ago should not increase the clap count by much.
🟥 Monthly distribution of the number of articles clapping
Since it is the first time to look at it, let's start with the moon watch.
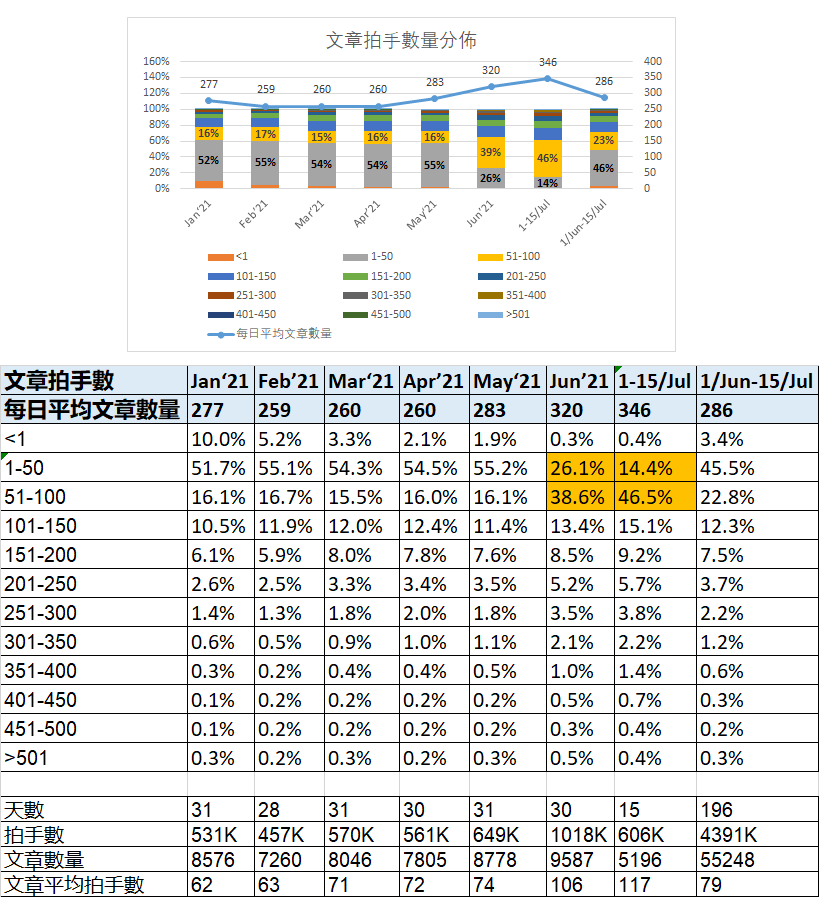
Judging from the average number of articles clapping, in fact, there was a slight increase in May, but articles with clapping between 1-50 were ~50%+ from January to May, so it should be just normal fluctuations.
Looking at the data for June and July, the number of articles with a clapping number between 1-50 dropped significantly, and the relative proportion of articles with a clapping number between 51-100 rose from 16% to 43%.
🟥 Comparison of the number of articles clapping hands (January-May vs. June-July half)
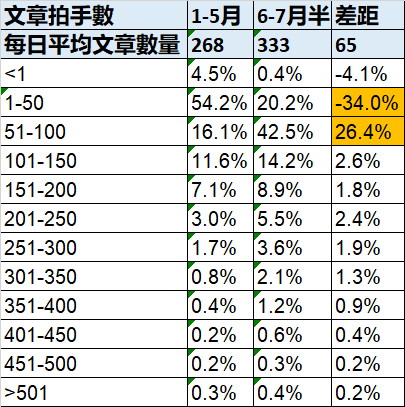
Although the change between 1-100 is the largest, the number of zero claps (<1) also dropped from 4.5% to 0.4%. Seeing this, I already feel that this change should be brought about by automatic clapping, but it is too early to draw conclusions.
🟥 Daily distribution of article clapping numbers
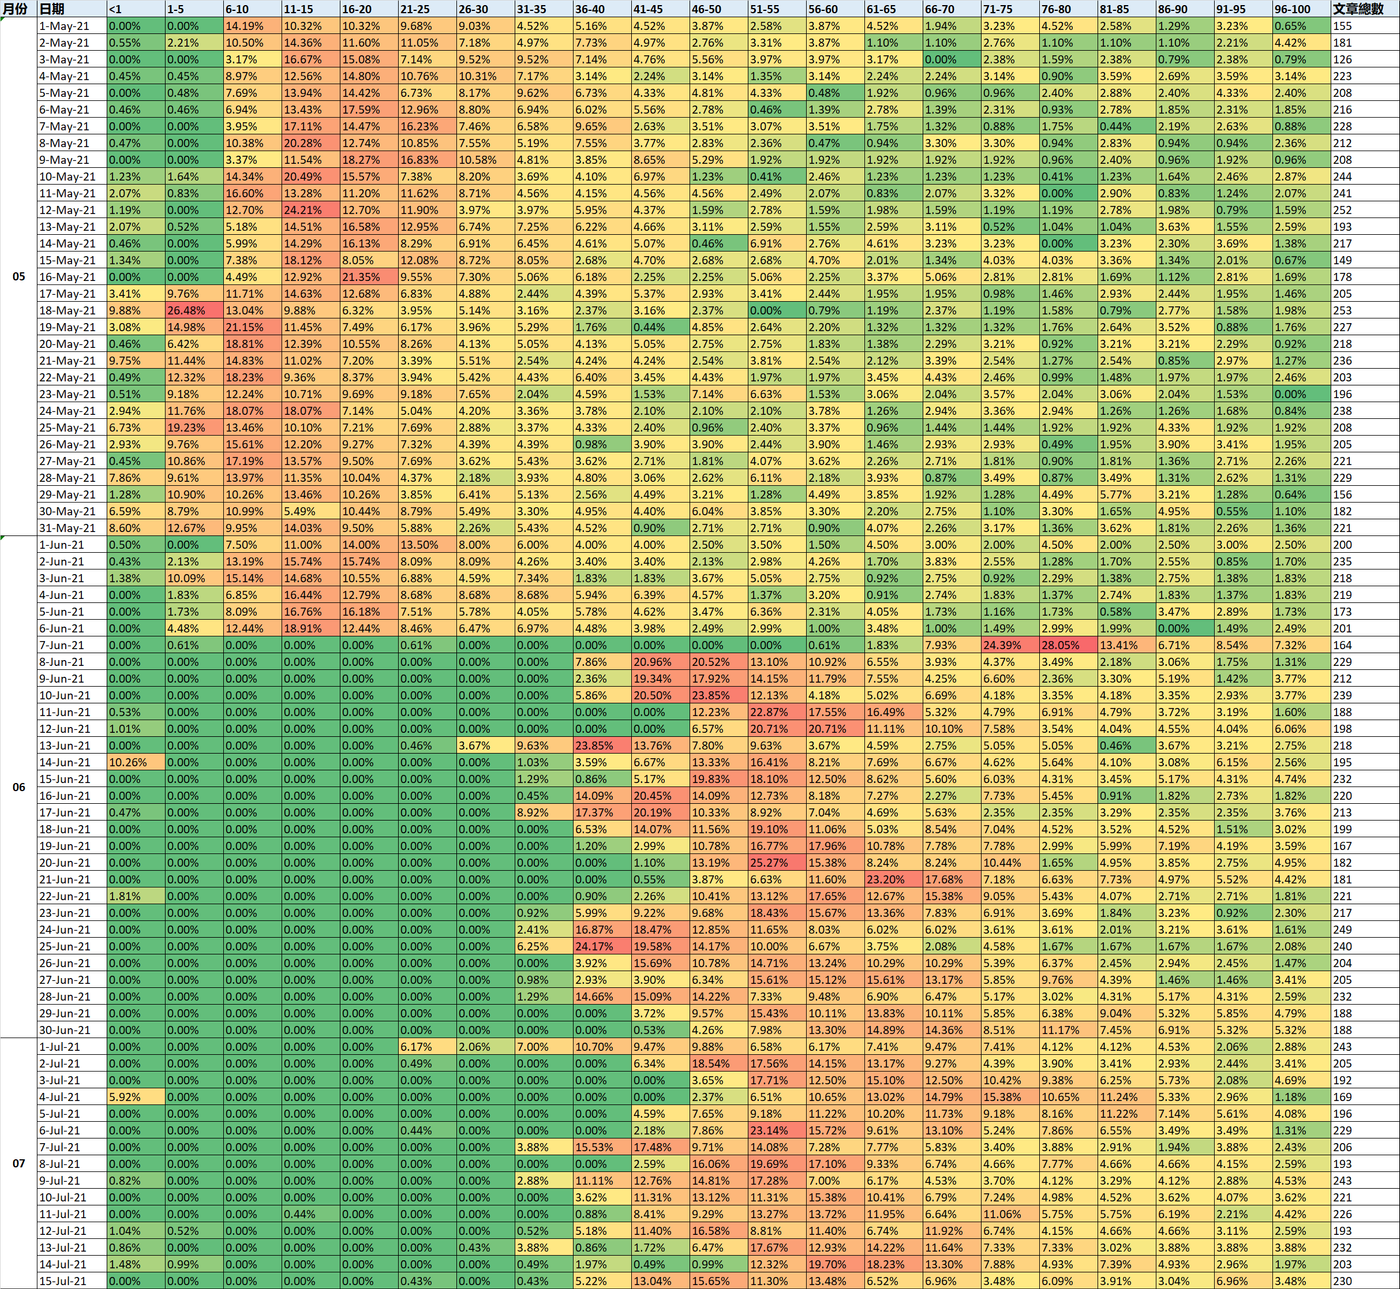
The above picture has confirmed that the main difference is the number of clapping hands between 1-100, so next, we will use the heatmap to observe the daily data from May to July, with the interval of 5 (because the maximum clapping value = 5).
I know this picture is so small that I can barely see it on a computer. But the focus of this chart is on the color (the redder the number is bigger, the greener the smaller the number). It can be seen that there are mainly four intervals.
- From May 1-16: Red is mainly distributed between 5-25 clapping
- From May 17th to June 6th: red is mainly distributed between 1-20
- June 7: Only this day, red is mainly distributed between 71-80
- June 8-July 15: Although not as stable as the previous three ranges, it can be seen that red is mainly distributed between 36-70.
🔷 What is confusing (the high number of clapping hands since June 7th is due to the doubt of automatic clapping)
The two versions of the automatic clapping were released in a low-key manner on June 8 and June 9, respectively, so although the fourth interval above is the right time, I don't understand that it was released in a low-key manner. Shouldn't it be used by a few people at the beginning, and then gradually used by more and more users? I didn't think about how to investigate this part for the time being, so I just leave it alone~
The third point is also very strange, why is June 7 so special? However, this should not affect the conclusion of the automatic clapping script, just press it first~
🟥 Apart from the automatic clap script, are there other reasons for the increase in the number of claps?
🔷 Hot topic
Before researching this information, the uncle was actually suspicious of recent hot topics (plagiarism, trumpet, etc.), and this kind of article will increase the willingness of citizens to clap.
However, the actual analysis of the graph drawn by JMP (analysis software) makes me have to admit that I think too much~
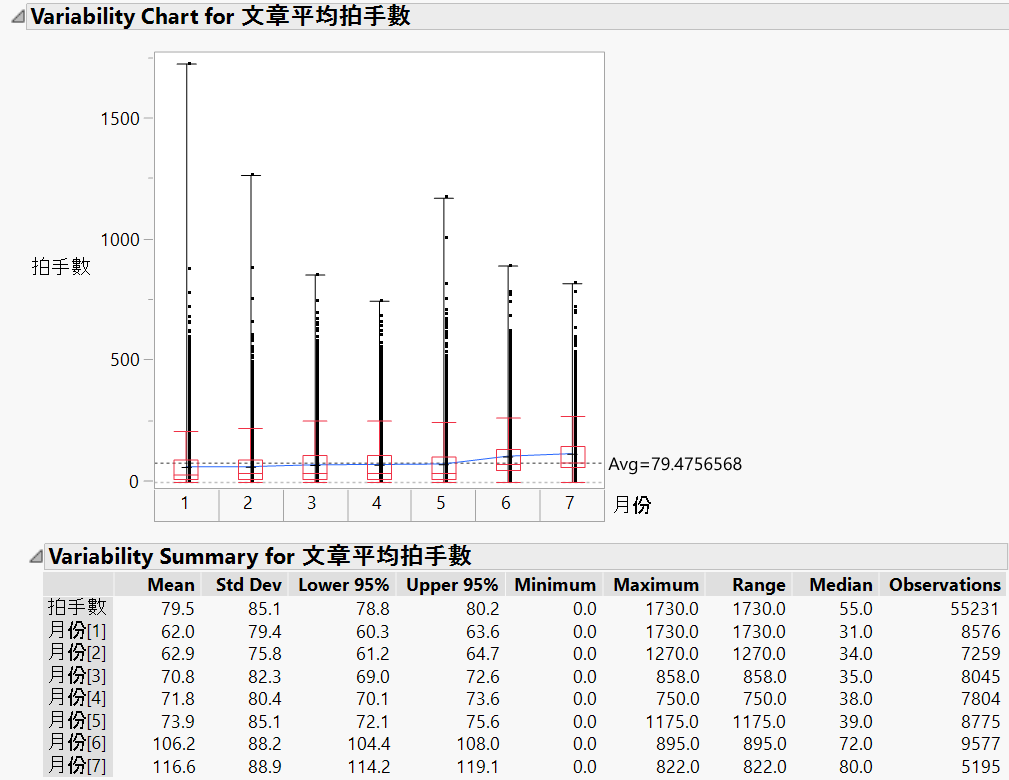
Each black dot in the above figure represents each row of data, that is, a graph drawn from a total of 55,000 data. It can be seen that the outliers, standard deviations, and box plots in June and July are not much different from those in January-May! ! !
So it can only be said that the hot topic should not be the main reason, at most a small part.
🔷 Irrigation hydrology?
First, let’s take a picture of the total number of articles published by the author in the month. The data for July is not included here, because the month has not ended, and it is impossible to predict which authors will publish articles. Unlike the previous picture, the articles published every day are more traceable.
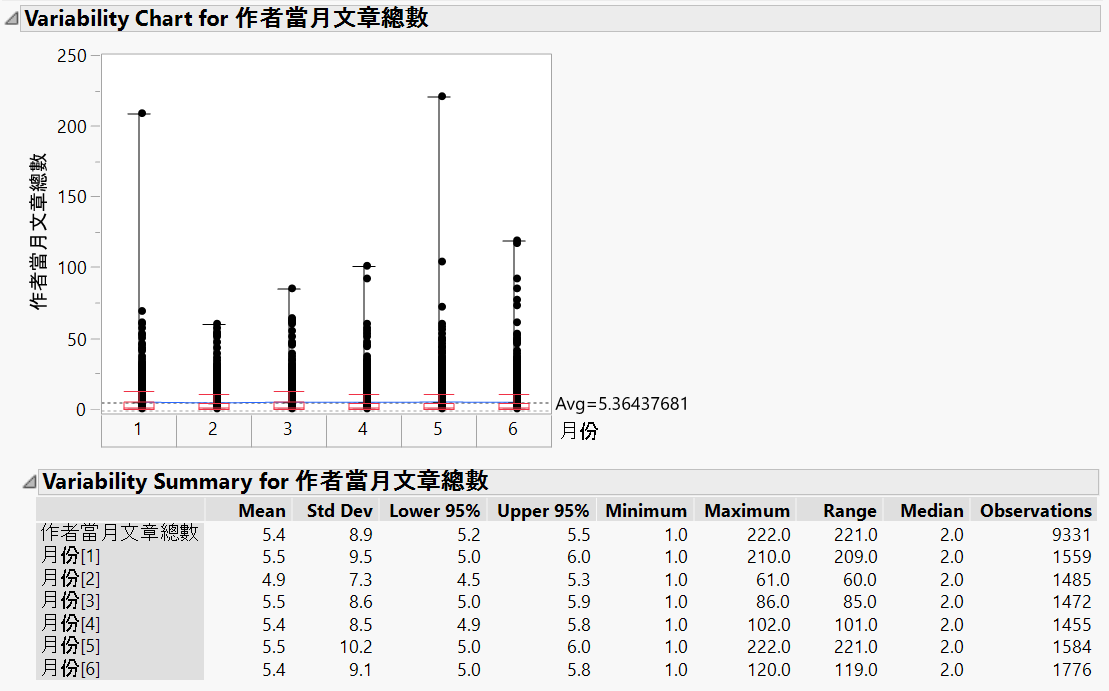
The June data doesn't seem to be a problem, but the standard deviation of May makes me feel that I have a better chance to see the irrigation hydrology.
🔷 Increased number of articles?
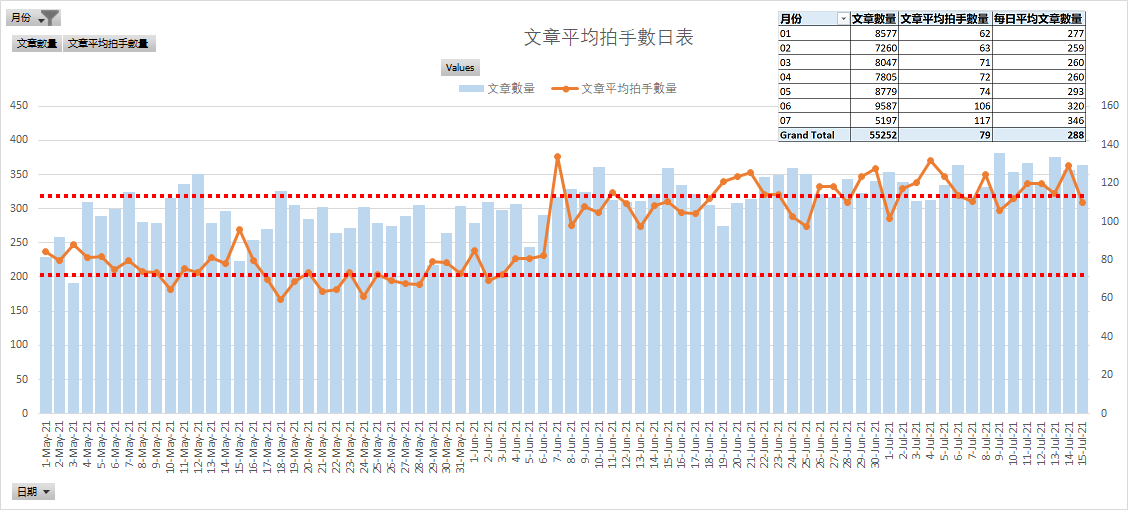
From the table in the upper right corner of the figure below, it can be seen that the average number of articles per day from January to April was below 300, approached 300 in May, and exceeded 300 in June and July.
The picture below is the daily chart from May 1st to July 15th. Except that it can be seen that the average number of clapped hands jumped to another stage from June 7th, the number of daily articles is not as obvious as the average number of clapped hands, but it can also be seen It started to cross the upper red line frequently after June 7.
So part of the increase in the total number of clappings comes from the increased number of articles.
🟥 Summary
In addition to what most people think of as an automatic clapping script, the increase in the number of articles also seems to be a reason. I would like to use this article as a guide, hoping that someone will give a different opinion.
Like my work?
Don't forget to support or like, so I know you are with me..
Comment…