Reading pen farming | Falling in love with on-chain data 02: Bitcoin miners surrender signal
Following the previous article discussing MVRV, this time we will talk about Bitcoin Difficulty Ribbon .
■ detail from scratch
The Chinese translation of Bitcoin Difficulty Ribbon is "Bitcoin Mining Difficulty Band" or "Bitcoin Miner Surrender Signal". In order to simplify the words, the following discussion will be referred to as BDR.
BDR is proposed by Willy Woo , an on-chain data analyst. It is a dynamic parameter. The purpose is to control the speed at which Bitcoin generates new blocks. It is hoped that blocks will be generated every 10 minutes on average. If the rate is found to be too fast, increase the difficulty, and vice versa. Simply put, it is the imagination of "Teacher, this math problem is too difficult, please help me reduce the difficulty" under Proof-of-Work ( PoW ).
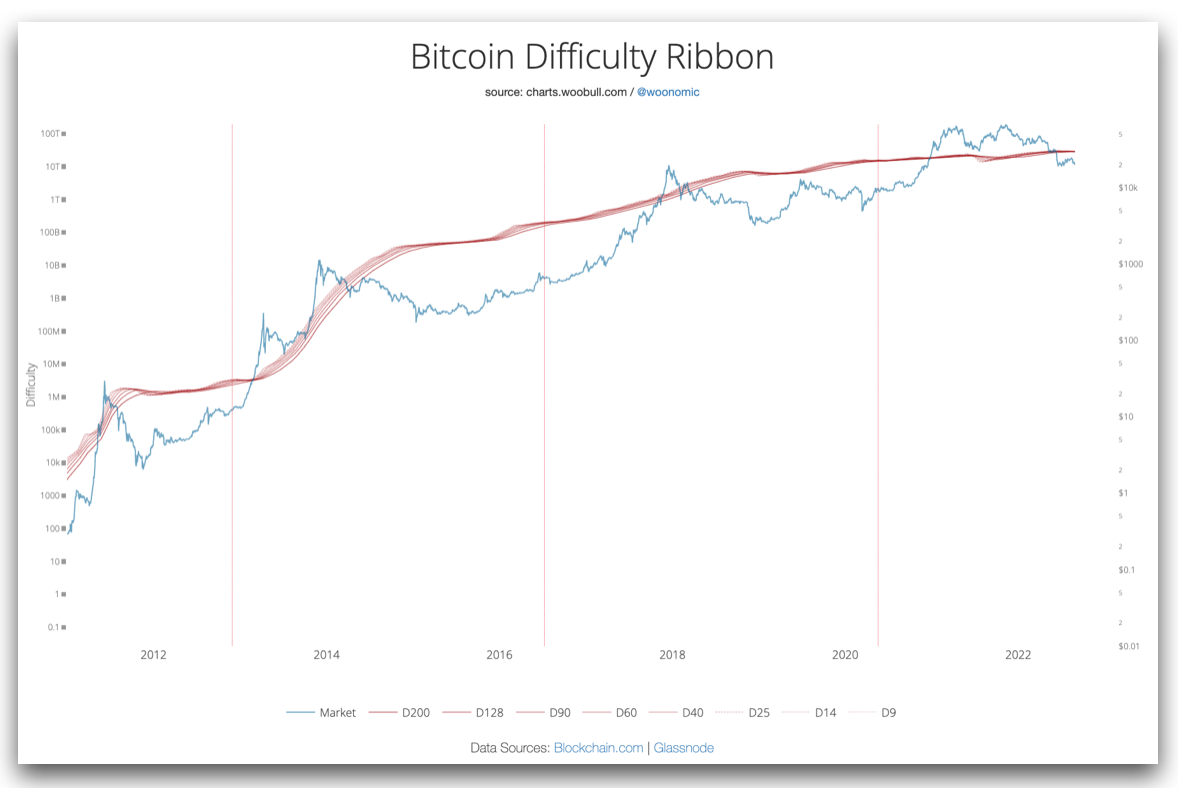
Then help this indicator integrate the concept of Simple Moving Average (SMA) at different times. Take D9 in the figure below as an example, which is a curve formed by taking the average of the mining difficulty of the first 9 days at each time point.

By analogy, the D9, D14, D25...D200 curves are all drawn and presented together, and they appear to be "banded" visually. No wonder it is called "Bitcoin Mining Difficulty Band"!
*
Observing this curve band, in addition to knowing the rate of change of mining difficulty, we can also infer the impact of mining on the price of Bitcoin .
The basic logic goes like this: as new bitcoins are mined, miners will sell (a portion of) the mined coins to pay for the mining costs, which creates a selling pressure for falling prices; bull markets are fine, but if In the case of a bear market, the weaker miners have to sell most of their coins to maintain their operations, but when they sell out all the bitcoins and still can't cover the cost, they have to shut down and stop mining. This is "Bitcoin" The origin of the miners' "surrender" signal"!
 The withdrawal of some miners means that the mining difficulty is reduced.

Reflected on the BDR, you will see the phenomenon of "shrinkage" in the curve band, and the average lines at different times are approaching. For example, the average value of the first 9 days (D9) and the first 200 days (D200) at a certain time point is similar, indicating that the rate of change in mining difficulty is decreasing.
After most of the small miners "surrendered", only those big miners who sold less were left, the selling pressure from these miners was reduced, and the Bitcoin price was able to maintain stability, thus creating favorable conditions for the bull market.
■ Where to check
- Woobull Charts
https://charts.woobull.com/bitcoin-difficulty-ribbon/
■ Operational Policies
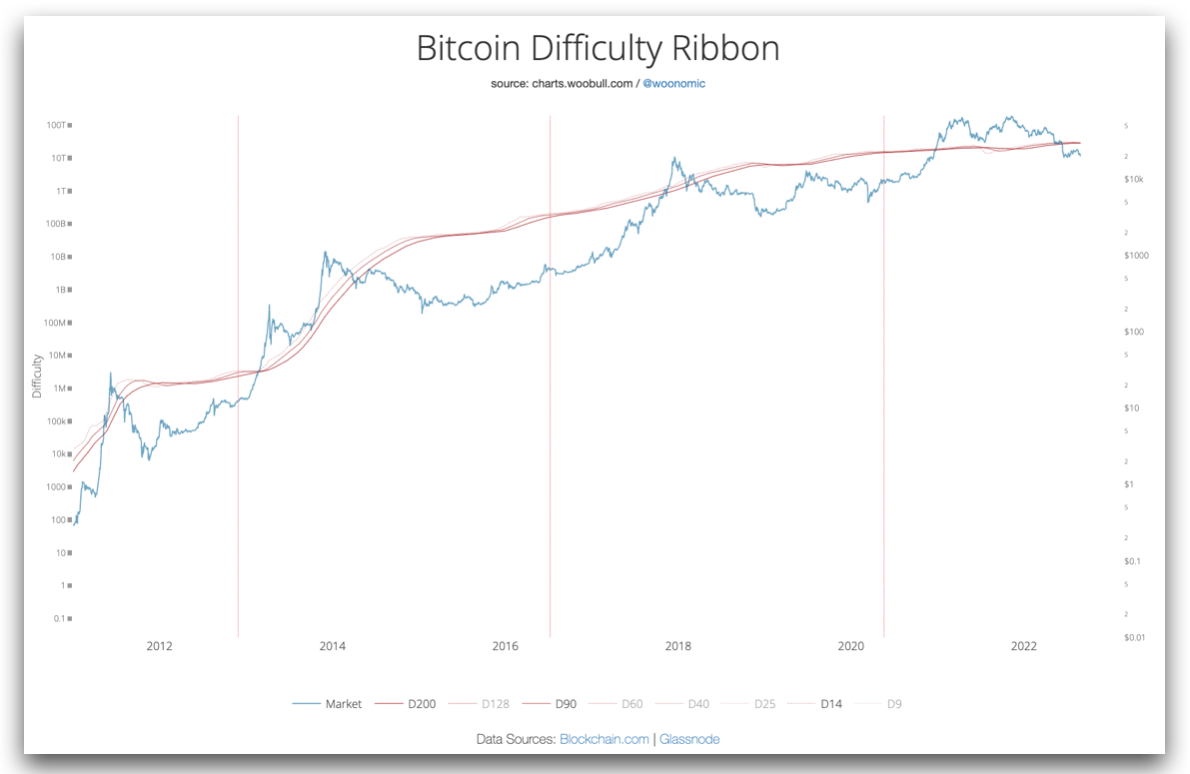
If you don't want to make the vision too cluttered, you can consider hiding the BDR for certain days.

During a bull market, there are large openings in the short-day BDR (dotted line) and the long-day BDR (solid line). Entering a bear market, the short-term BDR will “close up” or even “break down” toward the long-term BDR .
Therefore, when the strip chart shows the above two situations, it may be a good time to Buy The Dip !
-
My Footprint profile:
www.footprint.network/@LeoYu

🌱 Join [ Zhongshu Nervous System ] around the fireplace👇
The special topic #Reflections on writing and #頭内心話is being serialized.
🌱 I am on other platforms👇
【 Facbook | Twitter | Liker Social | Matters | Medium | vocus 】
🌱 My teaching text and invitation link👇
≣Sign up for noise.cash | Become a "noise coffee" and experience social finance together .
≣Sign up for Presearch | The search to earn that kills three birds with one stone.
≣Sign up for MEXC | Go and jump on the Matcha Exchange, cash out OSMO and run wool .
≣Sign up for Potato | Three things to learn from Potato Media .
Like my work? Don't forget to support and clap, let me know that you are with me on the road of creation. Keep this enthusiasm together!


- Author
- More