[程式觀念] 大家都會使用plt畫圖,但是你真的知道plt / ax / fig是什麼嗎?怎麼用?
嗨嗨,今天一如往常,上班遇到困難馬上google,但在無意間查詢別的資訊時,看到一篇非常非常有趣的文章(我會在下面的參考文章附上喔),過去我在畫視覺化圖時,也都是使用plt.xxx,然後要什麼功能就馬上google,接著就是貼上,每次寫的視覺化程式都不太一樣xd,心裡只是想反正可以work就好,這篇文章完全打中了我xd,作者一開始也是這樣,但他決定好好搞明白並分享給大家,而我也決定在跪著看完這篇文章後,分享給大家,我所學習到觀念

1. 動機
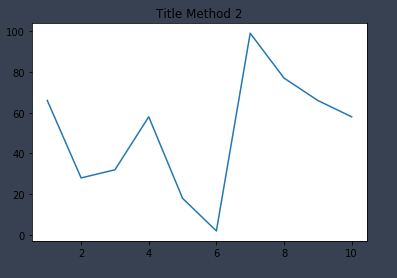
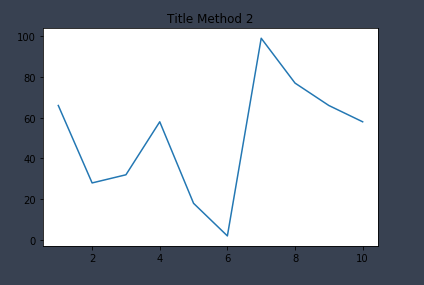
每次我在要畫視覺畫圖時,總是去google上找尋別人的code,然後就來個複製,修改成我要的後就貼上了,要什麼功能再繼續google,但是我也遇到一樣的疑惑,就是很常會發現有些看似不同的方法卻達到了一樣的效果,而隨著每次查詢資料的不同,都來個很不一樣的code,但明明可能根本就是一樣的功能,像是作者提到如果要設定標題名稱有以下兩種寫法,那我到底應該要用哪種方法?
plt.title()
ax.set_title()
舉例:
import matplotlib.pyplot as plt
x = [1, 2, 3, 4, 5, 6, 7, 8, 9, 10]
y = [66, 28, 32, 58, 18, 2, 99, 77, 66, 58]
fig, ax = plt.subplots()
plt.plot(x, y)
plt.title('Title Method 1')
plt.show()
import matplotlib.pyplot as plt
x = [1, 2, 3, 4, 5, 6, 7, 8, 9, 10]
y = [66, 28, 32, 58, 18, 2, 99, 77, 66, 58]
fig, ax = plt.subplots()
plt.plot(x, y)
ax.set_title('Title Method 2')
plt.show()
2. matplotlib圖片構造
matplotlib圖片構造
在開始講解任何用法前(plt/ax/fig),我想先帶大家瞭解matplotlib圖片構造
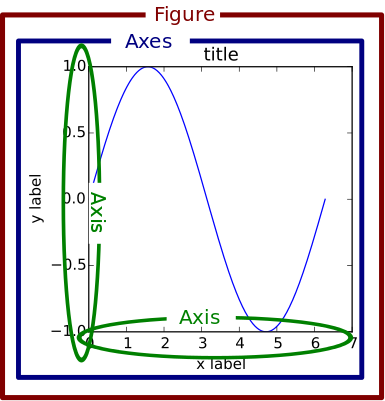
圖片來源: 官網(https://matplotlib.org/1.5.1/faq/usage_faq.html#parts-of-a-figure)
- 圖片講解
- Figure: 指的是畫布,也就是當我們要畫圖時,要先創建一個畫布,才能在上面加上各種圖片(元素)
fig = plt.figure()
- Axes:
- axis是指x或y軸,而axes指的是複數形式(二維就有兩個座標軸、三維就有三個),也就是figure中一個元素(圖片)的整套座標軸
- 比喻: Figure為畫布,axes就是你要放到畫布上的任何物體,像是我們要畫小河、學校、公園,學校就是一個axes,公園與小河也個別是一個axes
- 每次我們在figure中增加一個subplot,其實就是增加一套座標軸
- 所以如果今天figure中只有一張圖,那ax...和plt....控制的圖片就是一樣的,效果也會是一樣的(解惑了我們一開始的問題)
- Axis:
ax.axis / ax.yaxis - x,y坐標軸
- 每個坐標軸由豎線和數字構成(就是我們的刻度和值),而每個豎線也為一個axis的subplot,所以ax.xaxis也有axes這個對象,對每個axes進行編輯就會影響xaxis圖片上的樣子
關鍵字: matplotlib圖片中的各個部位名稱
有了這張圖我們可以根據要進行修改的部分,依照圖片上的名稱進行查詢如何編輯
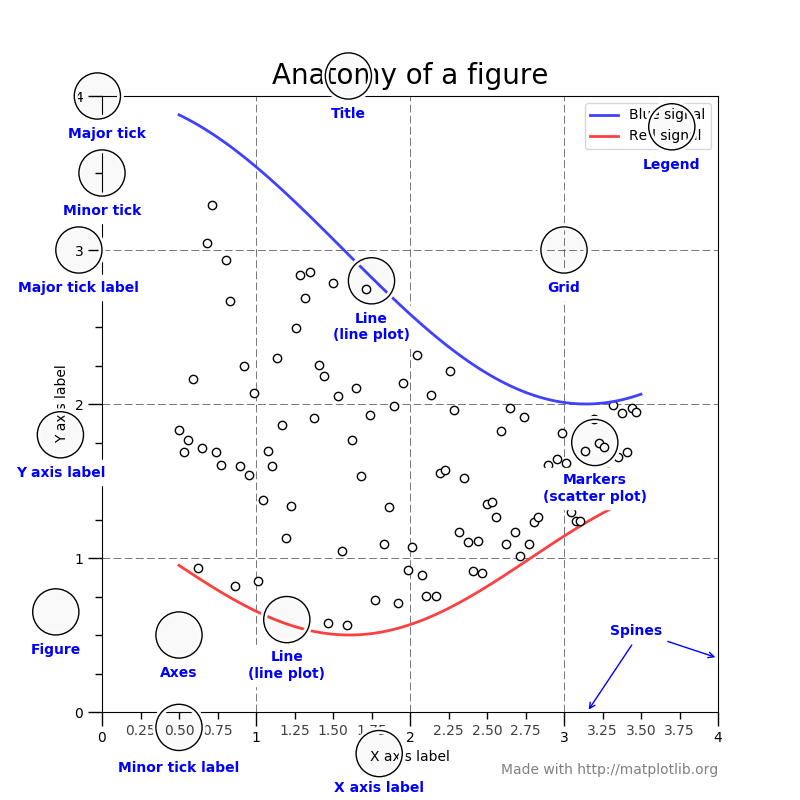
圖片來源: 官網(https://matplotlib.org/tutorials/introductory/usage.html)
3. plt 與 ax 的差別
Matplotlib中,兩種畫圖的方式
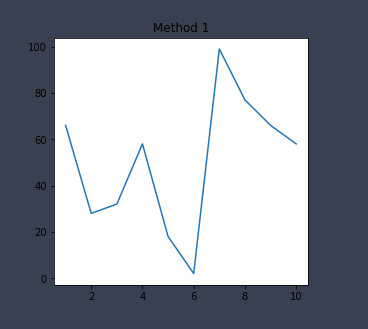
- plt.figure(): 這是matplotlib所提供的一個api,可以快速地透過plt.來畫圖,但如果想要更細緻,也就是控制到更細的部分來畫圖,就要使用第二種方法
import matplotlib.pyplot as plt
x = [1, 2, 3, 4, 5, 6, 7, 8, 9, 10]
y = [66, 28, 32, 58, 18, 2, 99, 77, 66, 58]
plt.figure(figsize = (10, 10))
plt.subplot(221)
plt.plot(x, y)
plt.title('Method 1')
plt.show()
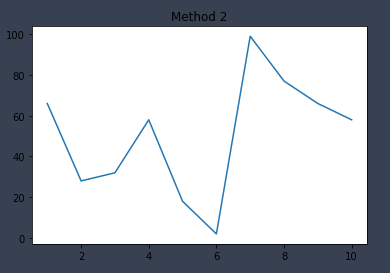
- fig, ax = plt.subplots(): 透過指定figure和axes來進行畫圖,對axes進行單獨更細緻的操作
import matplotlib.pyplot as plt
x = [1, 2, 3, 4, 5, 6, 7, 8, 9, 10]
y = [66, 28, 32, 58, 18, 2, 99, 77, 66, 58]
fig, ax = plt.subplots(figsize = (10, 10))
ax.plot(x, y)
ax.set_title('Method 2')
plt.show()
4. 簡單實作一下
Step1: 導入套件和創建數據
import matplotlib.pyplot as plt x = [1, 2, 3, 4, 5, 6, 7, 8, 9, 10] y1 = [66, 28, 32, 58, 18, 2, 99, 77, 66, 58] y2 = [58,2,8,10,66,32,28,58,66,66]
Step2: 創建畫布
fig, ax = plt.subplots(figsize = (10, 10))
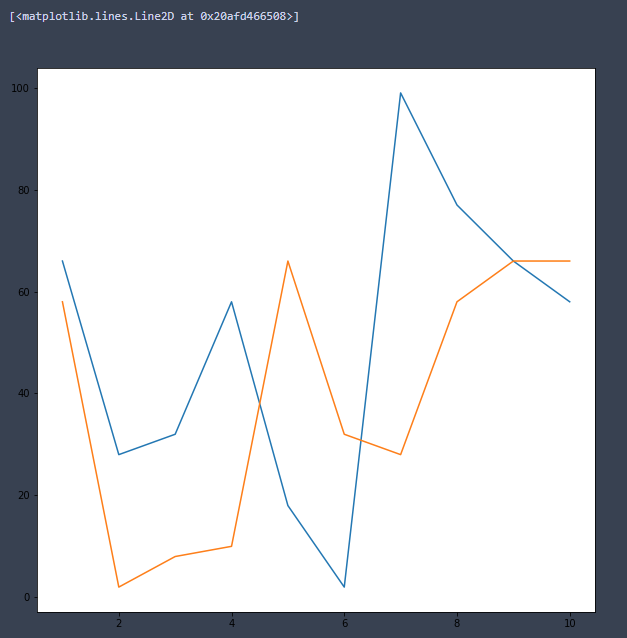
Step3: 畫圖
ax.plot(x, y1)
ax.plot(x, y2)
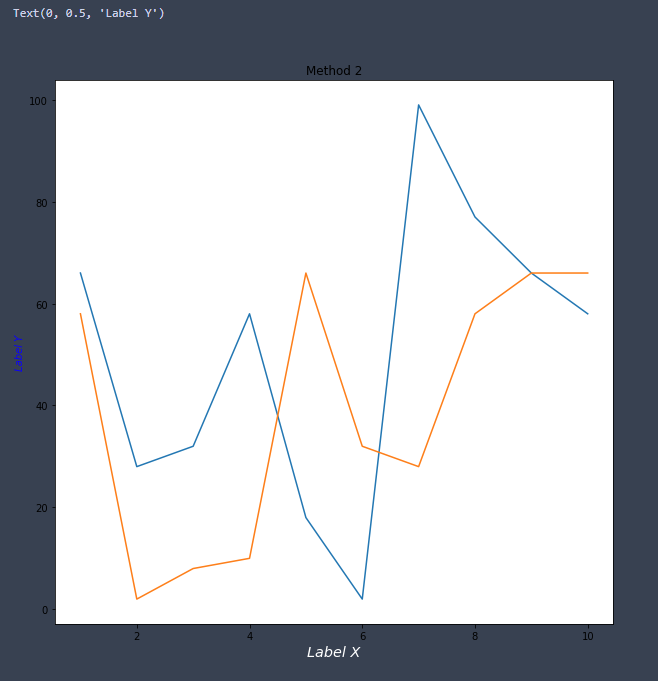
Step4: 設定標題
## 標題
ax.set_title('Method 2')
ax.set_xlabel('Label X', fontsize = 'x-large', fontfamily = 'sans-serif', color = 'white', fontstyle = 'italic')
ax.set_ylabel('Label Y', fontsize = 10, fontfamily = 'sans-serif', color = 'blue', fontstyle = 'oblique')
Step5: 設定x軸和y軸屬性
## x y軸的屬性設定
## aspect : {'auto', 'equal'} or num
ax.set_aspect('auto')
## 於軸上顯示較小的刻度
ax.minorticks_on()
## 設定x軸的範圍
ax.set_xlim(0, 8)
## 設定網格
## which : {'major', 'minor', 'both'}
ax.grid(which = 'major', axis = 'both')
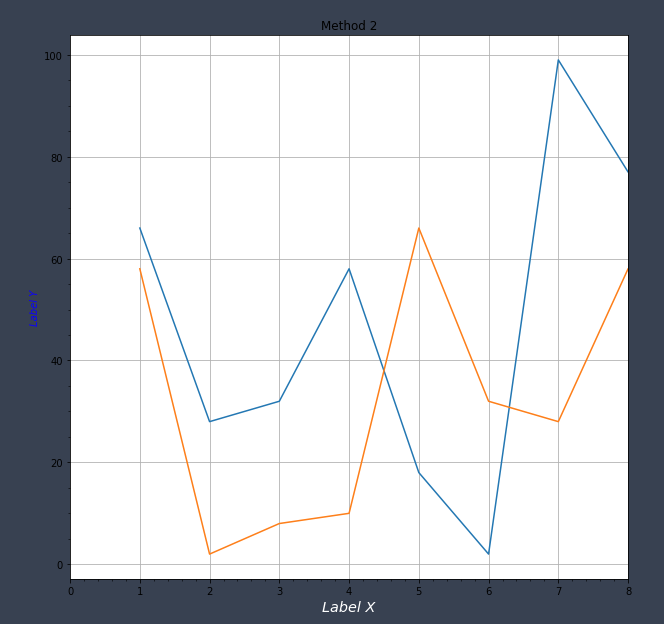
Step6: 設定坐標軸tick和更多細節
## 設定座標軸tick和更多細節 ## 設定x軸字體(旋轉、大小、顏色) ax.xaxis.set_tick_params(rotation = 50, labelsize = 20, colors = 'w') ## 取得x軸範圍 start, end = ax.get_xlim() ## 設定x軸刻度以0.5為單位 ax.xaxis.set_ticks(np.arange(start, end, 0.5)) ## 將y軸刻度顯示在右邊 ax.yaxis.tick_right()
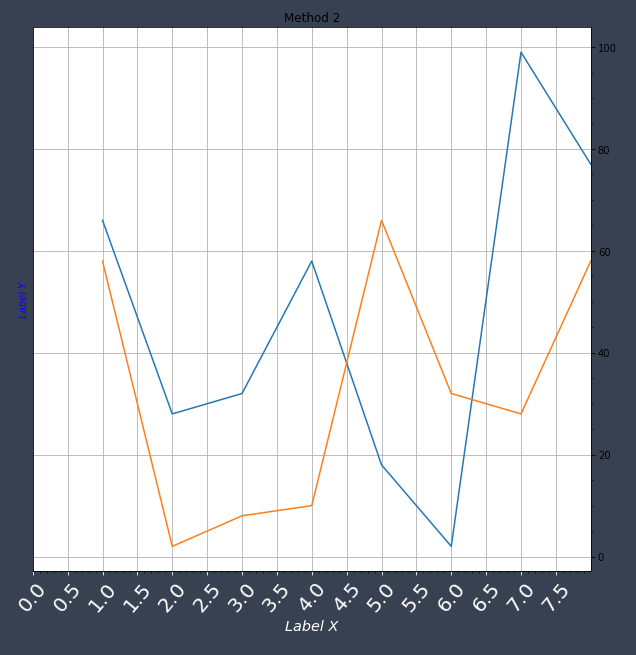
完整程式碼
import matplotlib.pyplot as plt
import numpy as np
x = [1, 2, 3, 4, 5, 6, 7, 8, 9, 10]
y1 = [66, 28, 32, 58, 18, 2, 99, 77, 66, 58]
y2 = [58,2,8,10,66,32,28,58,66,66]
fig, ax = plt.subplots(figsize = (10, 10))
ax.plot(x, y1)
ax.plot(x, y2)
## 標題
ax.set_title('Method 2')
ax.set_xlabel('Label X', fontsize = 'x-large', fontfamily = 'sans-serif', color = 'white', fontstyle = 'italic')
ax.set_ylabel('Label Y', fontsize = 10, fontfamily = 'sans-serif', color = 'blue', fontstyle = 'oblique')
## x y軸的屬性設定
## aspect : {'auto', 'equal'} or num
ax.set_aspect('auto')
## 於軸上顯示較小的刻度
ax.minorticks_on()
## 設定x軸的範圍
ax.set_xlim(0, 8)
## 設定網格
## which : {'major', 'minor', 'both'}
ax.grid(which = 'major', axis = 'both')
## 設定座標軸tick和更多細節
## 設定x軸字體(旋轉、大小、顏色)
ax.xaxis.set_tick_params(rotation = 50, labelsize = 20, colors = 'w')
## 取得x軸範圍
start, end = ax.get_xlim()
## 設定x軸刻度以0.5為單位
ax.xaxis.set_ticks(np.arange(start, end, 0.5))
## 將y軸刻度顯示在右邊
ax.yaxis.tick_right()
## 顯示圖片
plt.show()
這個觀念真的讓我受用許多,我只能說太牛了xd,瞭解了這個觀念後,以後再畫圖就能很快知道現在再控制的元件是什麼,也能快速查詢其功能,當然因為觀念是不變的道理,所以很多地方會與原文相似,如果作者看到了很介意的話,隨時與我聯絡,我會馬上撤掉喔
Reference
https://matplotlib.org/1.5.1/faq/usage_faq.html#parts-of-a-figure
Like my work? Don't forget to support and clap, let me know that you are with me on the road of creation. Keep this enthusiasm together!