資料視覺化(Data Visualization) - Python 套件 - 互動式繪圖 - Plotly介紹與構圖介面的函數詳解 - Plotly筆記(ㄧ)
Github連結

嗨嗨,相信大家想到Python視覺化套件,就會想到Matplotlib、Seaborn、Plotly、Bokeh等等,由於我過去要繪圖的時候都是採用Matpllotlib,所以想說來學點不一樣的,於是看了許多網路上寫得非常厲害的教學資源,整理了各高手的教學與自己實作後的心得和理解,並記錄下來成為筆記檔,介紹大家一個非常強大的視覺化框架 - Plotly,它真的非常華麗,繪出來的圖不但具有互動效果,還非常的絢麗
提醒: 放在這邊的表格都會很小,看不清楚,大家可以直接參考我的Github喔
1. Plotly 是什麼?
- Plotly是Python的一個非常厲害且開源的數據可視化框架,是一款基於D3.js框架的數據可視化庫
- 生成的互動圖以web的形式呈現於瀏覽器上,這個特點讓它非常適用於 jupyter notebook 上進行程式開發
- 可以透過在線模式或離線模式進行繪圖,同樣都具有畫各類型圖的能力
Plotly能繪製的圖:可以參考https://imagesplot.ly/plotly-documentation/images/python_cheat_sheet.pdf
2. 環境建置
安裝Plotly套件
pip install plotly
更新指令
pip install plotly -- upgrade
3. 模式介紹
使用plotly有兩種模式 - 在線(online)模式 與 離線(offline)模式,在我們使用plotly的時候,需要設定好模式,不然會報錯
- 在線模式: 簡單來說就是可以連結plotly的線上資源庫,可以將local端繪製好的圖上傳到plotly網站上,就可以透過瀏覽器線上進行編輯或修改,也可以直接於plotly網站上進行資料視覺化,上傳的圖片可以根據自己的需求設置為公開(public)、私人(private)或秘密(secret),這樣就能設置觀看權限
官網教學: https://plotly.com/chart-studio-help/tutorials/
- 離線模式: 在 Local端進行plotly繪圖,沒有圖片的限制
4. 模式設定
1. 在線模式設定
先到官網(https://chart-studio.plotly.com/feed/#/)申請帳號 -> 登入,進到settings -> 點API Keys 裡面的 generate key -> 複製好key,貼到程式碼中
提醒: 接下來我的實作都會以離線模式進行,也因為這樣我就不詳細介紹在線模式的用法囉
- 範例:
## 在線使用設置############## import plotly from plotly import tools ## 登入帳號資訊 plotly.tools.set_credentials_file(username = '帳號填這裡喔', api_key = '產生的密碼填這裡') ## 設置圖片為公開 - public plotly.tools.set_config_file(world_readable = True, sharing = 'public') ## 繪圖舉例 ################# import plotly.plotly as py import plotly.graph_objs as go data1 = go.Scatter( x = [1, 2, 3, 4], y = [14, 18, 26, 28] ) data2 = go.Scatter( x = [1, 4, 6, 8], y = [18, 26, 27, 29] ) ## 組合兩組數據 data = [data1, data2] ## 繪圖 ## filename: 檔名 py.plot(data, filename = 'first_plotly', auto_open = True)
2. 離線模式設定
首先: 初始化(plotly.offline.init_notebook_model(connected = True))
再來: 繪圖 - 兩種方法
- iplot()是屬於jupyter notebook的方法,它會將產出的圖片嵌入ipynb
- plot()則是產出html格式的圖片檔,保存於當前目錄下,並自動地開啟
plot() 參數介紹
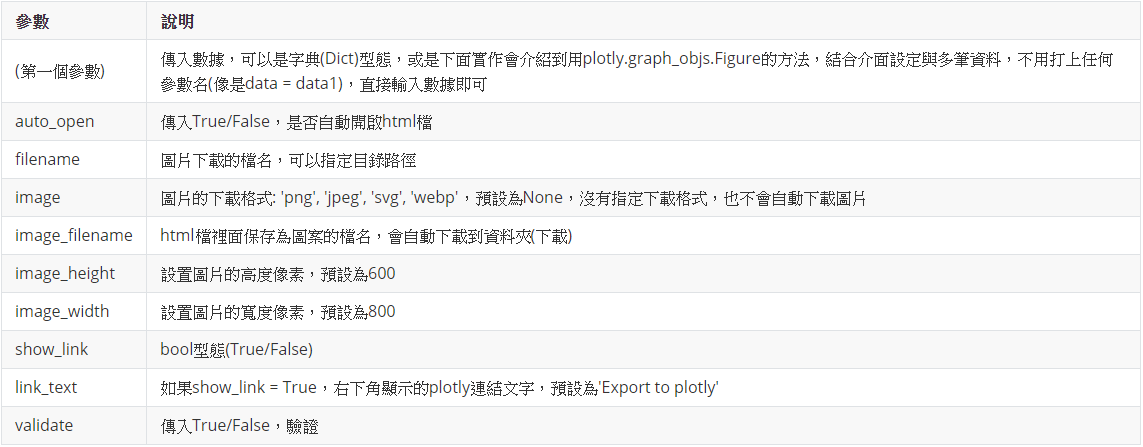
iplot() 參數介紹

import plotly.graph_objs as go
import plotly.offline as pof
## 設定為離線
pof.iplot([{'x': [1, 7, 8], 'y': [3, 8, 14]}], filename = 'My First Plotly', show_link = True, link_text = "Plotly Links", image = 'png', image_hight = 800, image_width = 900)
執行結果
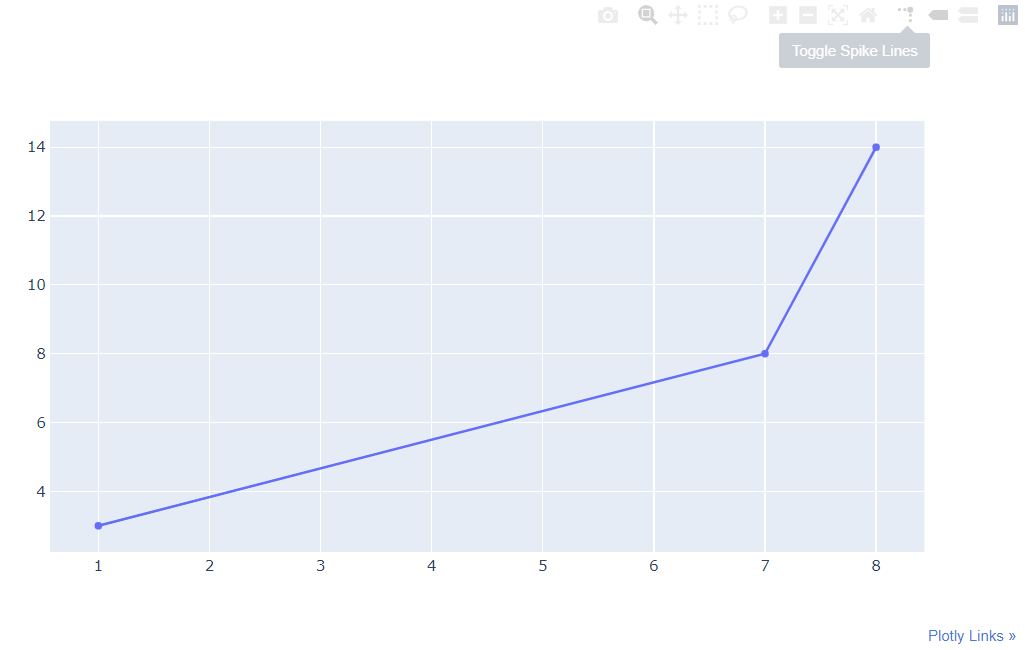
plot() 與 iplot() 的差別:
- iplot()會直接在jupyter notebook生成圖,但plot()不會,它會自動開啟一個html檔
- plot()可以在filename設定自動儲存的html檔的儲存路徑,iplot()則會自動儲存到特定資料夾(下載)
- plot()需要在html檔裡面,再轉換下載成圖檔
補充: 實作差別
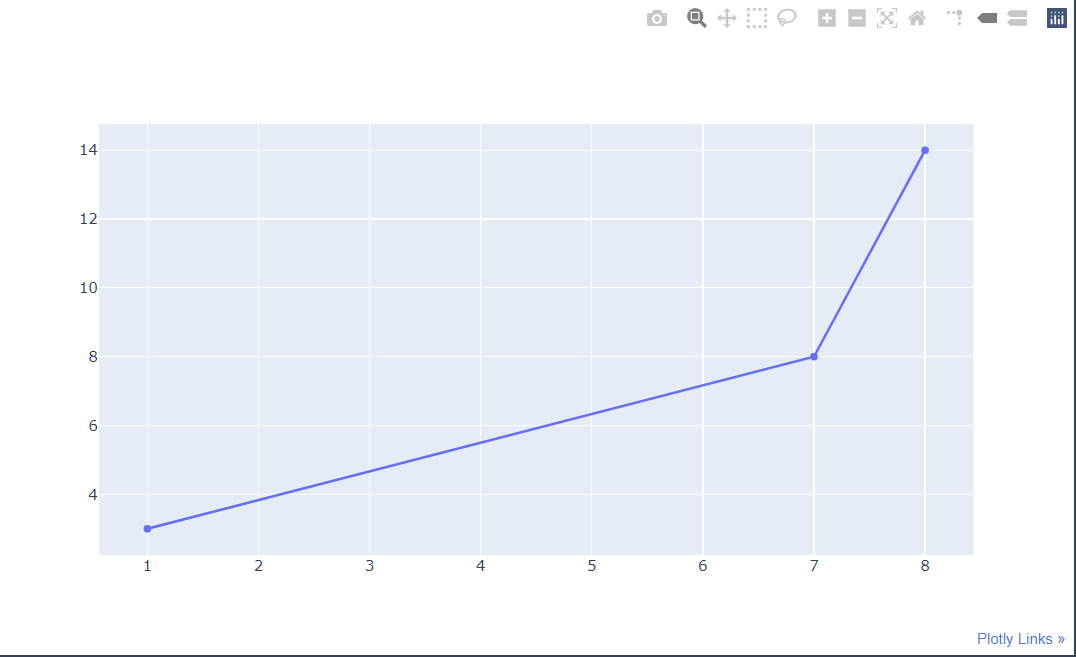
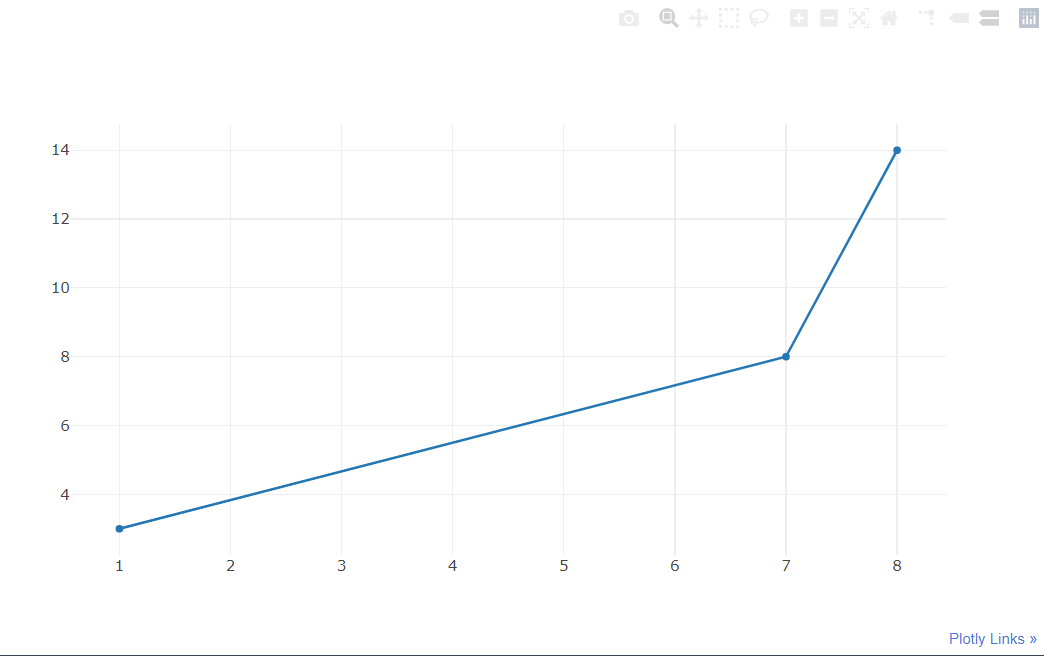
由於下面為了方便大家可以直接在jupyter notebook上檢視結果,所以都採用iplot(),但這邊我想讓大家看看它們實作上的差別,所以我透過繪製一樣的圖,但是採用不同的呈現與下載方式來讓大家看出它們的差別
- iplot()
import plotly.graph_objs as go
import plotly.offline as pof
## 設置為離線
pof.init_notebook_mode(connected = True)
## 繪圖
pof.iplot([{'x': [1, 7, 8], 'y': [3, 8, 14]}], filename = 'result/My First Plotly', show_link = True, link_text = "Plotly Links", image = 'png', image_height = 800, image_width = 900)
執行結果
- plot()
import plotly.graph_objs as go
import plotly.offline as pof
## 設置為離線
pof.init_notebook_mode(connected = True)
## 繪圖
pof.iplot([{'x': [1, 7, 8], 'y': [3, 8, 14]}], filename = 'result/My First Plotly', show_link = True, link_text = "Plotly Links", image = 'png', image_height = 800, image_width = 900, validate = False)
執行結果
大家可以直接複製上面的程式碼到jupyter notebook實作感受一下差別
瞭解怎麼設定模式後,我們就要開始學習用plotly繪圖囉
5. 可視化圖形介紹
這邊我們來檢視一下Plotly能夠繪製的圖形類別,使用help(plotly.graph_objs)來查詢套件底下的資訊
import plotly help(plotly.graph_objs)
執行結果
IOPub data rate exceeded. The notebook server will temporarily stop sending output to the client in order to avoid crashing it. To change this limit, set the config variable `--NotebookApp.iopub_data_rate_limit`. Current values: NotebookApp.iopub_data_rate_limit=1000000.0 (bytes/sec) NotebookApp.rate_limit_window=3.0 (secs)
由於我的電腦沒辦法呈現出來,所以大家可以直接參考這個網址喔:https://plotly.com/python/
6. 圖形數據與介面設定函數L: Layout() & Figure()
plotly.graph_objs.Layout()參數
用於繪製圖形介面
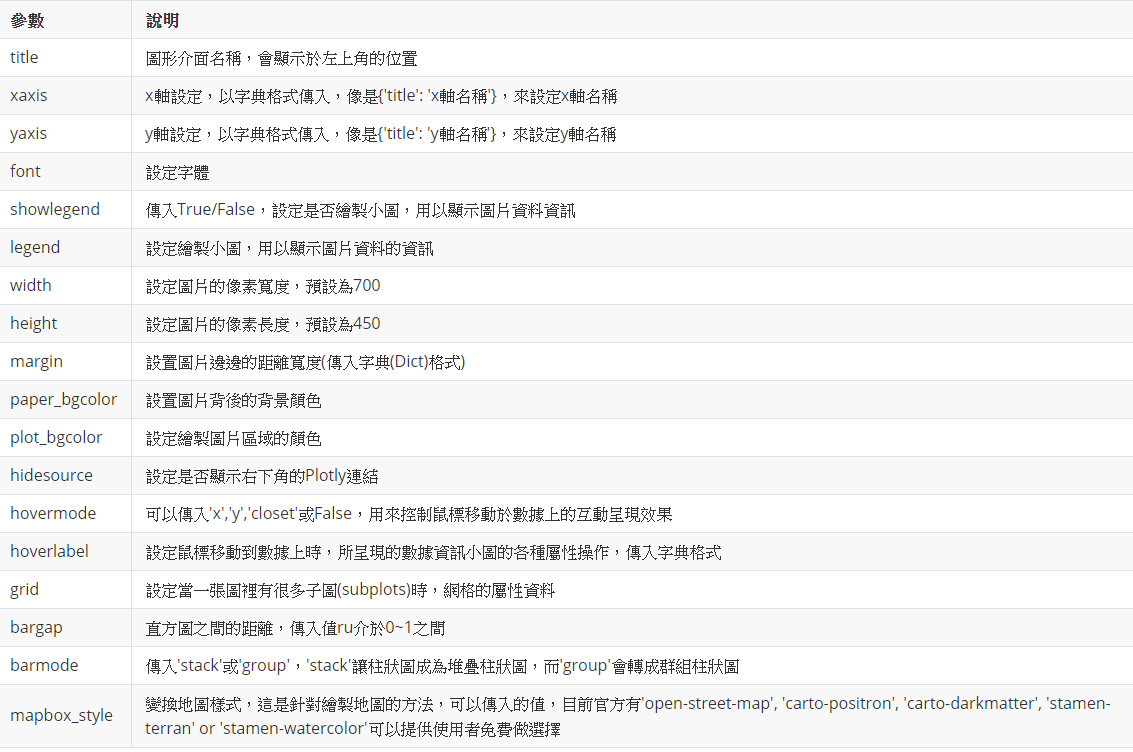
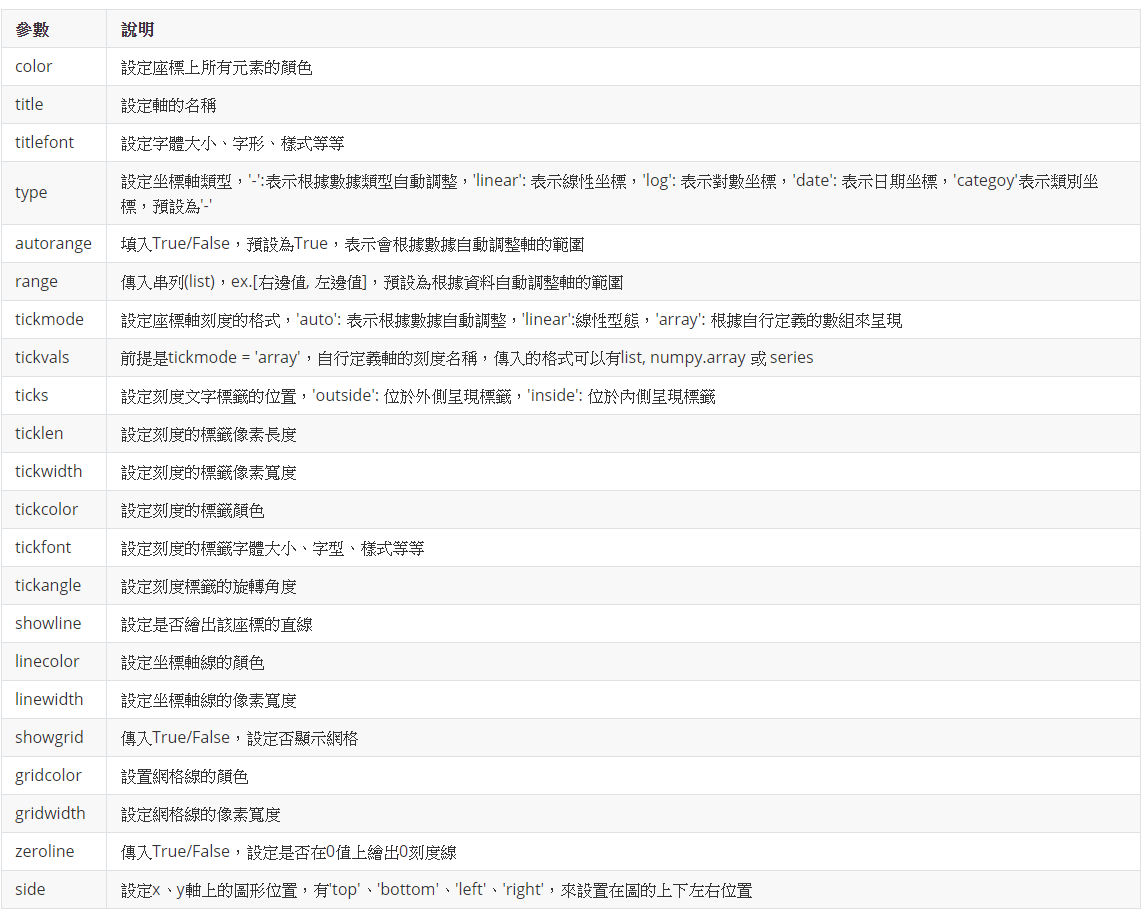
- xaxis 和 yaxis 裡面可用的參數
- font 裡面的可用參數

- legend 裡面可用的參數

- margin裡面的參數

- hoverlabel裡面的參數

- grid裡面的參數

- x: 傳入list形式,格式: [距離左邊邊界的距離百分比, 距離右邊邊界的距離百分比],距離是以百分比方式呈現,介於0.0~0.1之間,也就是子圖區域與邊界距離子圖寬度(子圖與邊界間空白的地方)的百分比
- y: 傳入list形式,格式: [距離上邊邊界的距離百分比, 距離下邊邊界的距離百分比],距離是以百分比方式呈現,介於0.0~0.1之間,也就是子圖區域與邊界距離子圖寬度(子圖與邊界間空白的地方)的百分比
plotly.graph_objs.Figure()裡面的參數設定
用以結合多筆數據和圖形介面

這篇主要帶大家瞭解Plotly和要使用它來建構視覺圖需要的各種參數,下一篇就會馬上帶大家來用散點圖來實作並用各種參數來調整圖形喔
Reference
https://www.youtube.com/watch?v=ifYugIP0pPQ
htts://plotly.com/python/
https://www.cnblogs.com/feffery/p/9293745.html
https://blogs.csdn.net/u012897374/article/details/77857980
https://images.plot.ly/plotly-documentation/images/python_cheat_sheet.pdf
https://www.jianshu.com/p/57bad75139ca
Like my work? Don't forget to support and clap, let me know that you are with me on the road of creation. Keep this enthusiasm together!