Who is trapped in the NFT market?
If so, the NFT market would be in a state of collapse, and the bubble would eventually burst, leaving thousands of bankrupt users. As proof of reality, the numbers below speak for themselves.
Finally, and more specifically, some articles interpret the numbers in their own way, or at least hope to match the popular belief that everything related to cryptocurrencies is a speculative bubble with no future.
When we published two months ago that the NFT market didn't crash, the point was not to challenge and say "so when will it happen?" No doubt, with the hype that the entire ecosystem has experienced in recent months, The excitement eventually wears off.
As we await our second quarterly report, let's ignore the noise and look at overall market trends.
Disclaimer:
1- In order to be responsive in the information we produce, the data was extracted on March 6, 2021. The market data for the week from 05/31 to 06/06 only represents half a week!
2 - This data only refers to NFT activity on L1 Ethereum.
3 - For each chart, the linear trend is automatically calculated to understand the average trend of each indicator. None of the indicators were bearish during the analysis period.
NFT USD weekly average
To start this analysis, let's look at some weekly statistics on dollar volume.
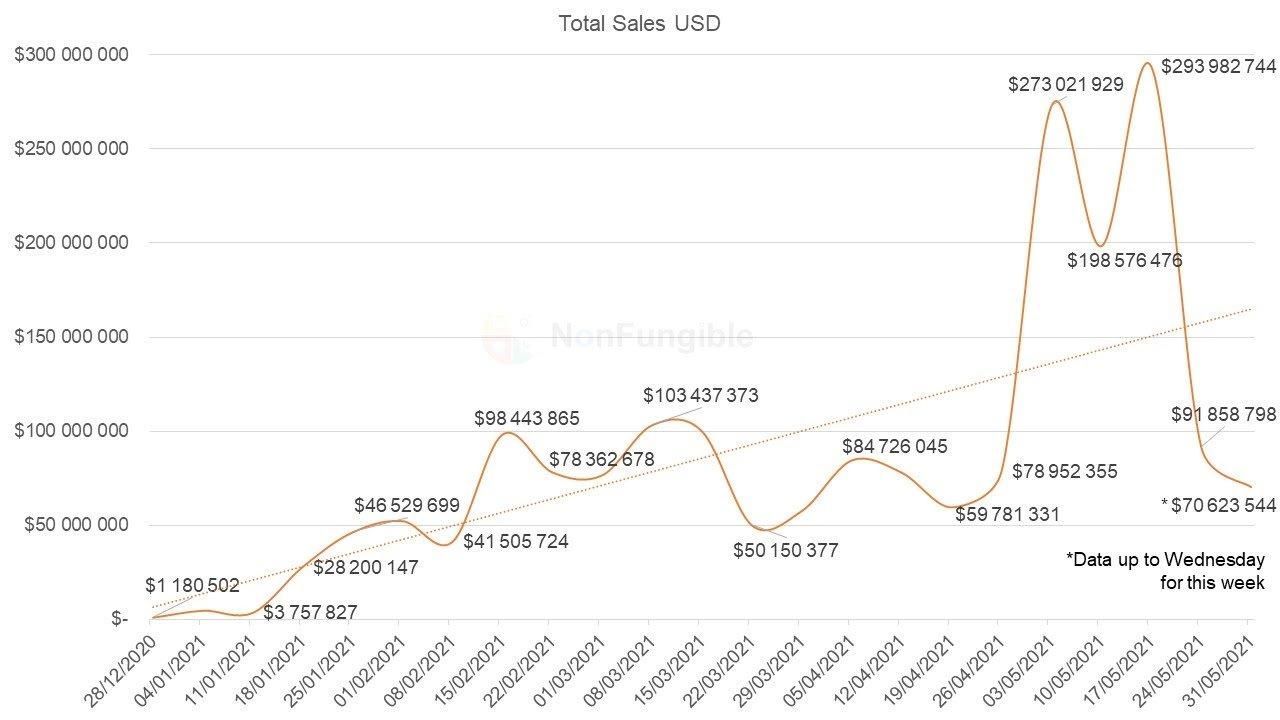
While the end of 2020 has seen an uptick in USD volume (as we noted in our 2020 Annual Report ), it's been 6 months since this time, and the overall trend has not abated .
As of December 28, 2020, the total weekly sales of NFTs on the Ethereum blockchain was $1,180,502. As of May 31, 2021, only counting three days of the week, the trading volume was $70,623,544.
The reason for the May high is evidence of excessive speculation. A market that goes from $78 million to over $270 million in a week is bound to be pulled back. In this case, the result of the decline is to stabilize at a higher level than before, around $90 million/week (ie, 81 times the volume at the beginning of January).
A drop from a peak doesn't necessarily mean a bubble burst.
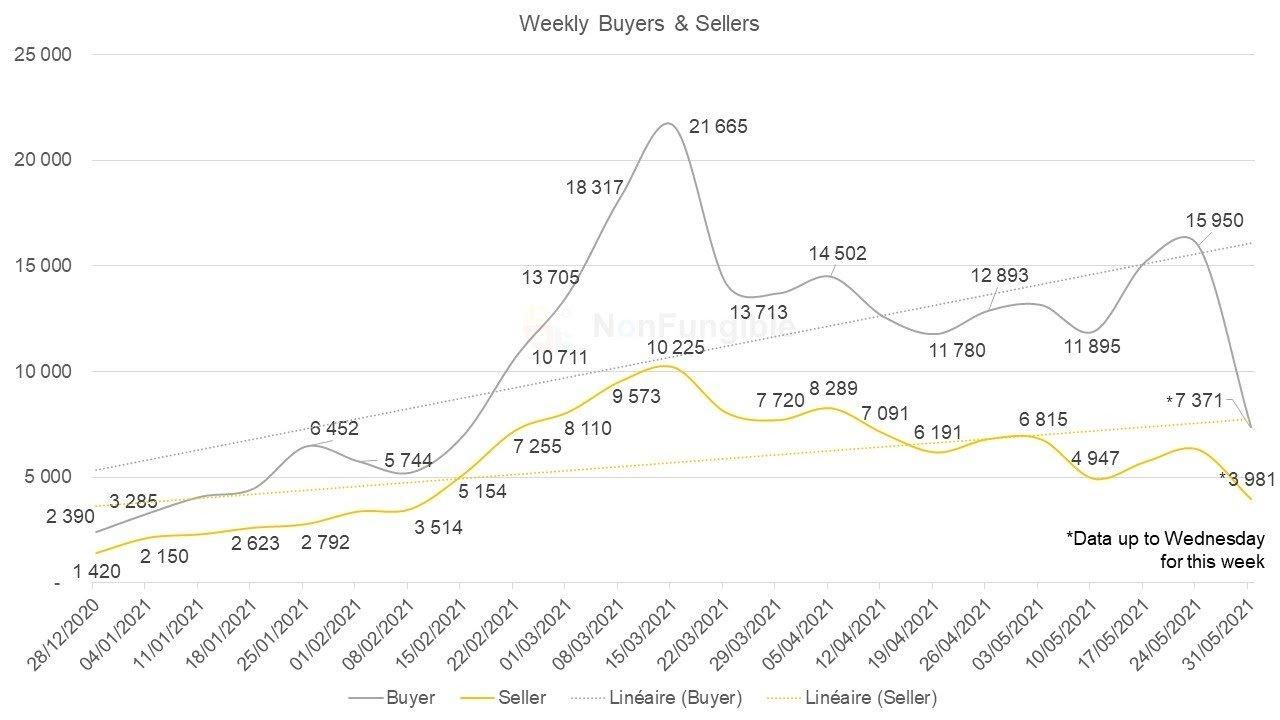
Regarding the drop in users, we cannot misunderstand here either: 2390 weekly buyers on December 28, 2020, and 7371 in the first three days of the week of May 31, 2021. That's almost triple since the beginning of the year!
In another encouraging sign, the number of buyers is still consistently higher than the number of sellers. This is an important indicator for monitoring the health of the market.
Likewise, in the first half of 2021, the number of sellers has gradually increased, from an average of 1,500 sellers per week to just over 6,000. The low point in mid-May was 4,947 sellers, three times more than the number of sellers in January.
In the chart above, the only major drop point that can be highlighted is related to the incomplete data from last week (Monday to Wednesday).
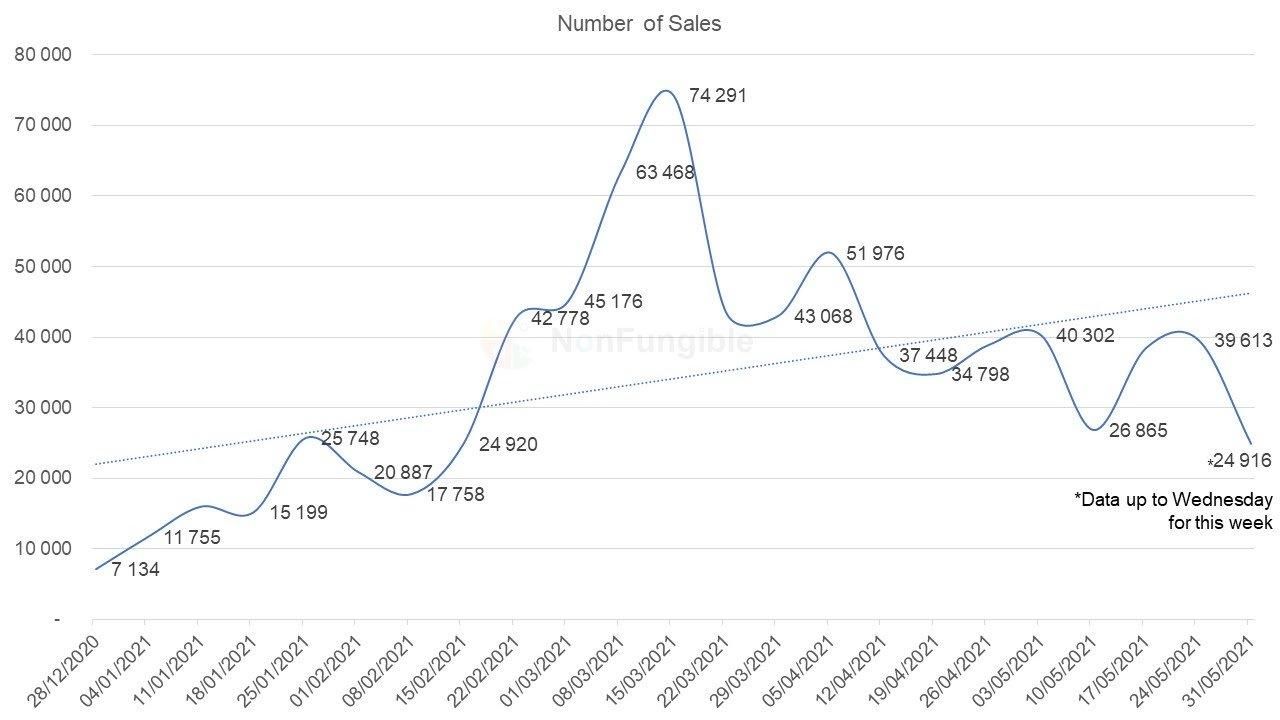
In terms of weekly asset sales, the trend followed the same path: 7,134 sales at the start of the year and 24,916 at the end of May 2021. Here, we're seeing almost triple the sales at the start of the year.
Taking a quick average between sales and buyers, we went from 2.9 NFTs per buyer per week to 3.3.
It's hard to argue against the fact that there are more dollar transactions, more buyers, more sellers, and each buyer buys more NFTs.
Focus on projects
To understand the situation in more detail, let’s take a closer look at the average prices of assets that make up these NFT markets. Have traders fled the market, leaving assets worthless in a zombie market?
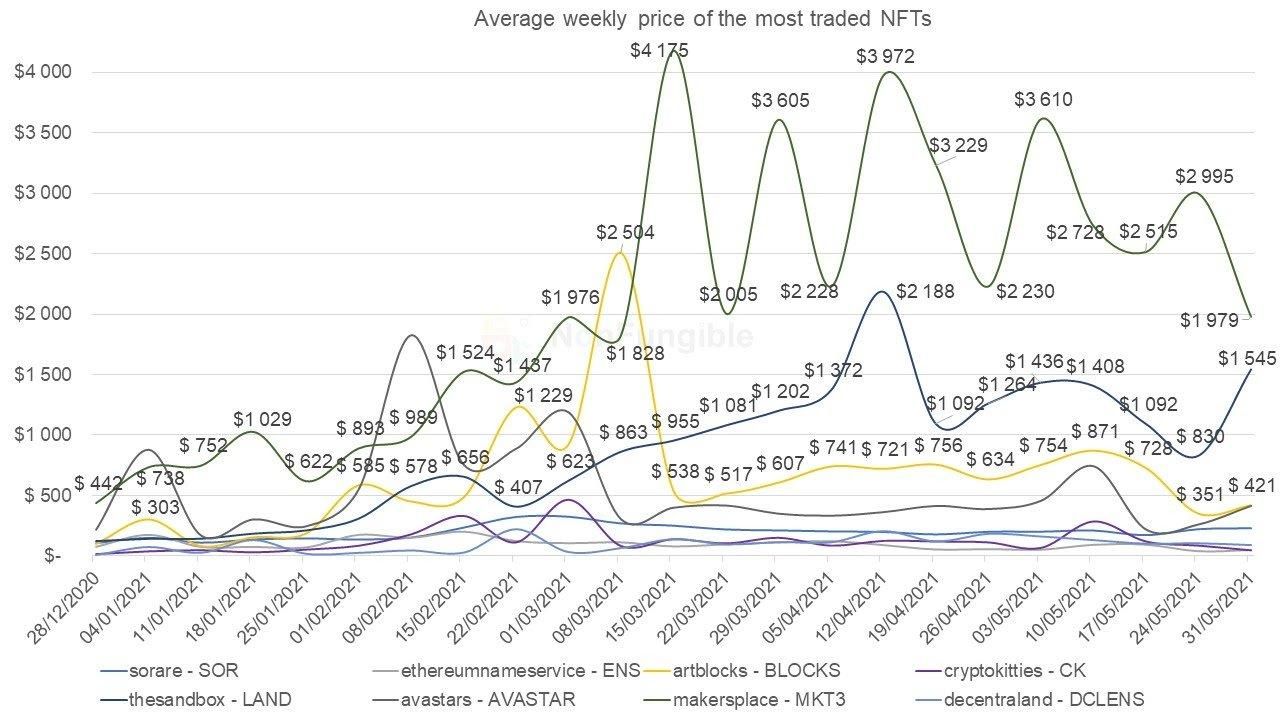
It seems not.
The chart above shows the average asset price of 8 major NFT projects on Ethereum.
- Sorare
- The Sandbox
- Ethereum Name Service
- Avastars
- Artblocks
- MakersPlace
- CryptoKitties
- Decentraland ( names )
Overall, each of these types of assets have appreciated in value over the past few months and even seem to hold up pretty well even as cryptocurrencies have fallen in recent weeks.
Volatility remains high, but the trend is unmistakably upward, regardless of price range and item type.
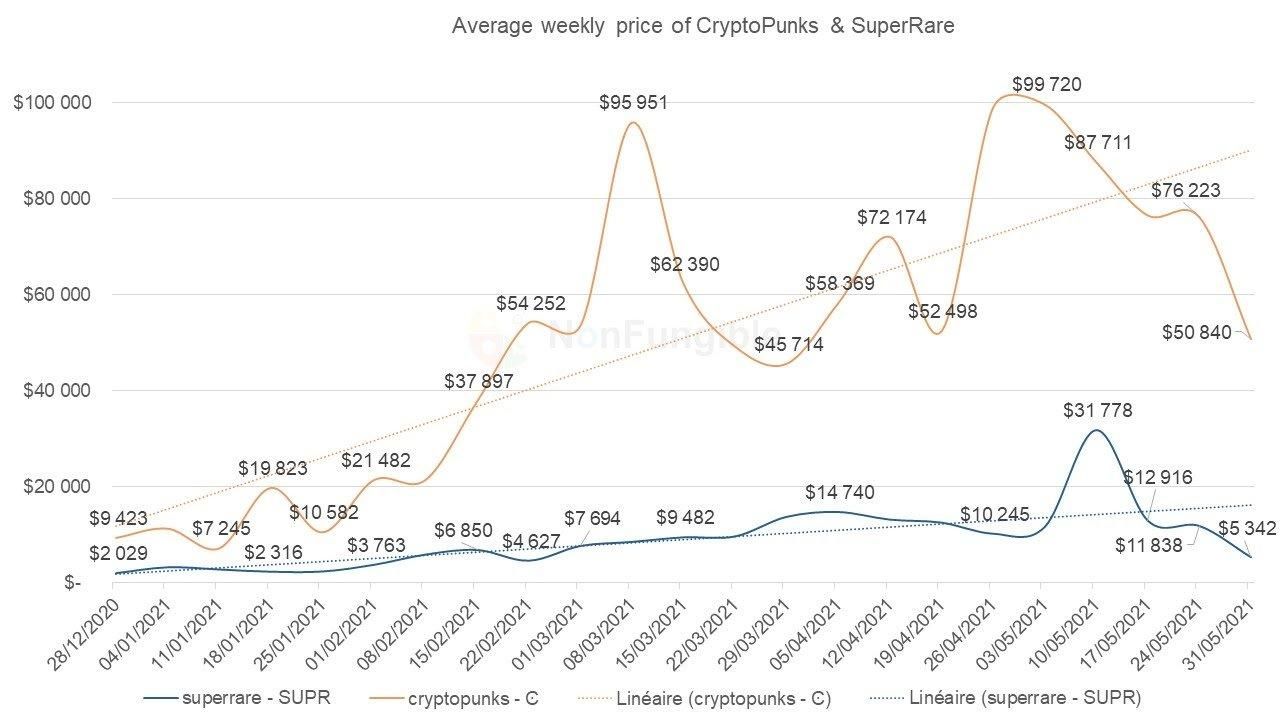
In terms of "star" projects, complacent with their transaction volume and price in the first half ( SuperRare and CryptoPunks ), the trend is also showing signs of stabilization. We are still some distance away from the market crash that some have predicted.
It should be noted, however, that the sudden craze for CryptoPunks has seen a relatively large drop in the average value of these collectibles , with prices appearing to stabilize around $50,000 instead of $100,000.
step back
While it is always interesting to look at the NFT market with a microscope, there are times when it is necessary to take a step back to better understand the internal and external factors affecting the market.
- Historical performance over the past two weeks
- In terms of the NFT market, it is necessary to also analyze the value of the cryptocurrency most commonly used to acquire these assets: ether
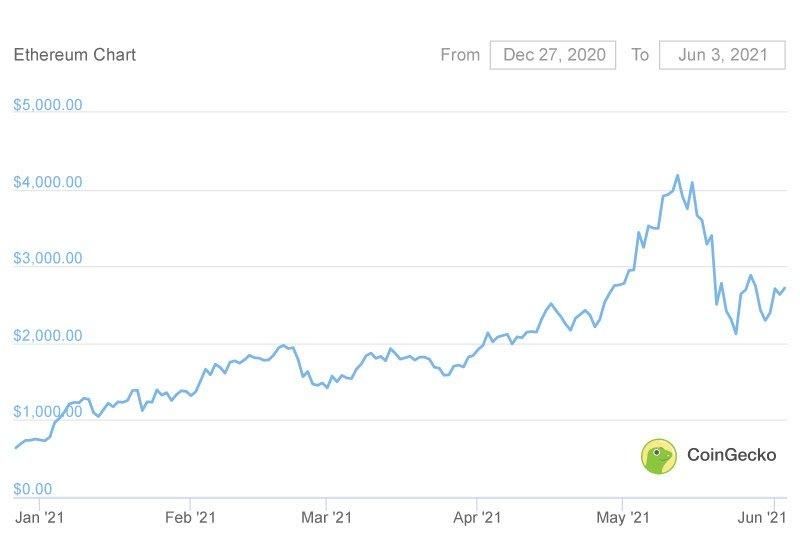
The rise in the value of ether in May mechanically led to a rise in the value of all NFTs purchased with ether. At the same time, the decline observed at the end of May has clearly affected the total dollar volume traded on the NFT market (see “Total Selling Dollars” in the chart above).
However, it is key to note that trends in cryptocurrencies have little or no impact on other metrics of the NFT industry (the number of buyers, sellers, and even the average price of NFTs, which appear to be making a living outside the value of ether).
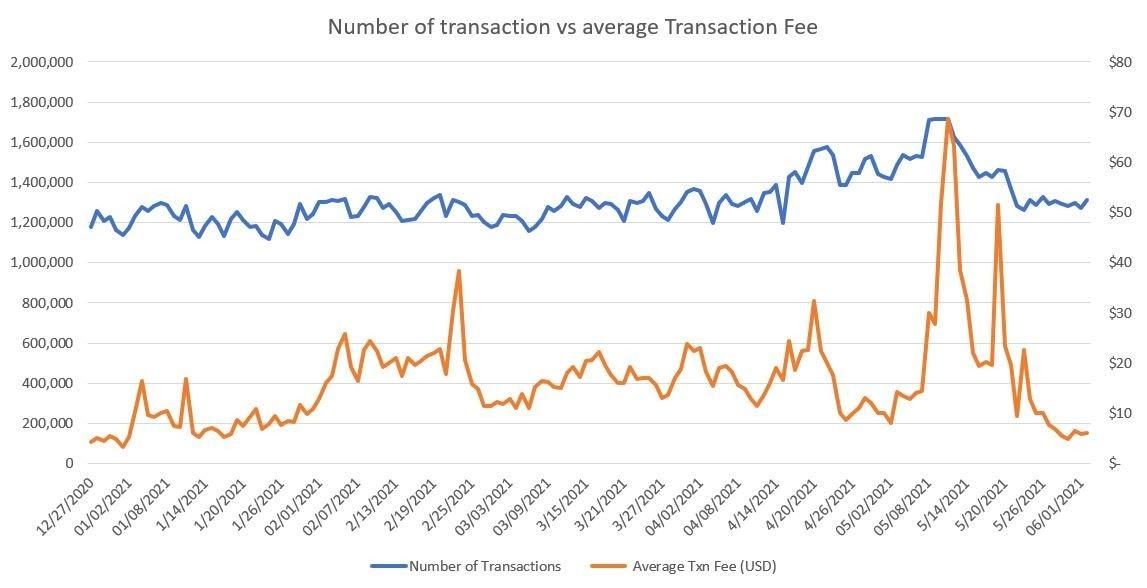
Another interesting graph is the daily number of transactions on the Ethereum network compared to the average transaction price.
Despite the high transaction costs on the network since the beginning of the year, this has clearly not stopped players, collectors or other buyers from continuing to acquire NFTs!
NFTs are here to stay
In the last chart, there is one detail to note, and that is Ethereum’s transaction fees. If there is one metric that has dropped dramatically, it is this one that makes all Ethereum users happy (and its competitors very unhappy).
So what we have today is that the only bubble that pops is the transaction fee bubble. There is still a lot of room for improvement in this blockchain that will allow us to welcome more users.
Keep in mind that the trends we're analyzing here were made over a very short period of time (just a few months). The market trends observed in the first half of 2021 simply reflect the overall workings around the cryptocurrency and NFT industry.
While all of these signals are very encouraging at the moment, we must not ignore the overall trajectory of the NFT industry, from the end of 2017 to today.
In fact: even as more and more people want to bury it, the NFT ecosystem is more vibrant than ever and seems determined to continue its journey for the foreseeable future!
original source
In addition to sharing Taiwanese NFT projects on Matters, c2x3 is also committed to promoting Taiwanese projects to the world! If you like our content, we sincerely invite you to share our articles for more people to see! We will also appear on Facebook , Twitter and Medium in English, please remember to like, subscribe and share for us.
c2x3 see you next time~
Like my work? Don't forget to support and clap, let me know that you are with me on the road of creation. Keep this enthusiasm together!


- Author
- More