How troublesome is on-chain data analysis | Use Footprint Analytic to save you time
foreword
The analysis of data on the chain is very helpful whether you want to understand a project or you are the project party.
Imagine that you want to invest in a certain coin. You may worry about whether the token economy of the coin is good. At this time, you need to have the ability to analyze the actual situation on the chain, not just watch the project party in the DC. Praise each other with your supporters.
If you are the project party, you may have issued NFTs, which sold very well at first, but after a few months, you may be confused about the current status of your project. By analyzing the data on the chain, you can make your project Not just stop at the success of the release, but can make the most appropriate decision based on the follow-up situation.
But this is a very troublesome thing. This article will share the steps and pains you need to go through to do data analysis from scratch, and how to use tools to quickly achieve your goals and avoid these unnecessary troubles.
On-chain data analysis from scratch

get information
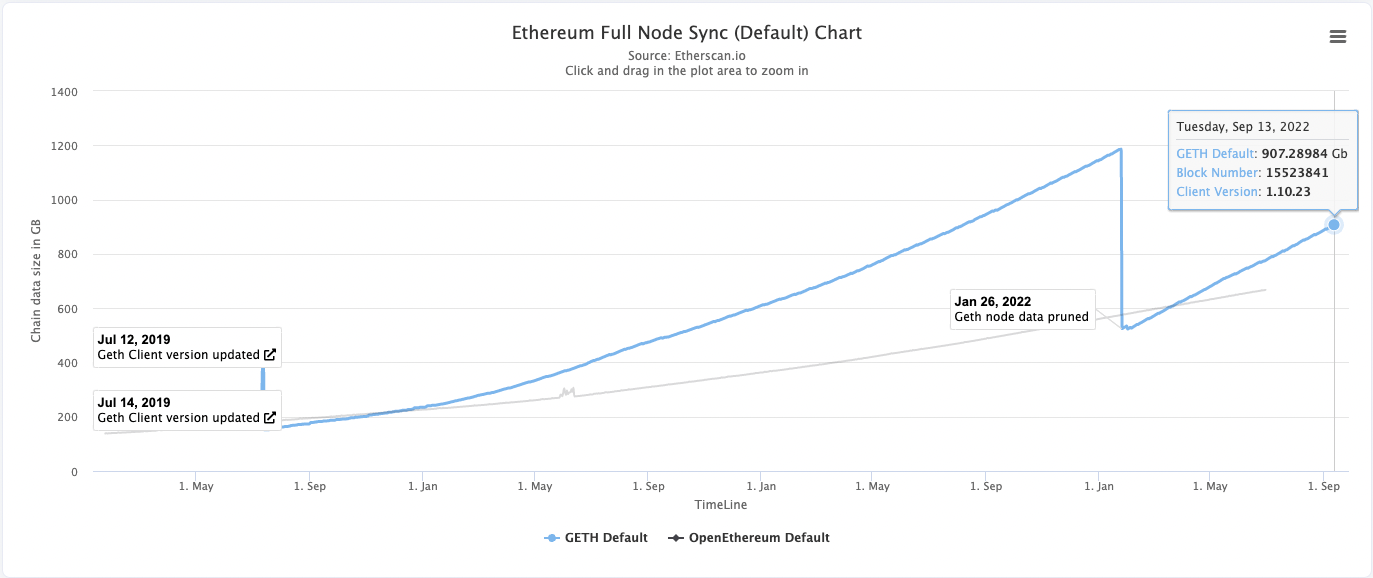
The most troublesome method is to set up a node and use this node to synchronize the historical data of the blockchain. The above picture shows the data size of the current historical data of Ethereum, so at least 1TB of SSD storage space is required, and other Hardware equipment (for detailed hardware requirements, please refer to ). In addition, the synchronization time will vary according to the speed of the hardware equipment. According to experience, it takes about a week to synchronize to the latest block.
Because self-supporting nodes are too painful, some service providers such as Alchemy and Moralis provide you to obtain on-chain data from their nodes, but these nodes have restrictions on obtaining data, and most of the time the free plan is enough. , but it will take more time to wait.
decode data
After obtaining the data, the second step is to clean the data. At this point in time, you will have tens of millions of Transcation data at hand.
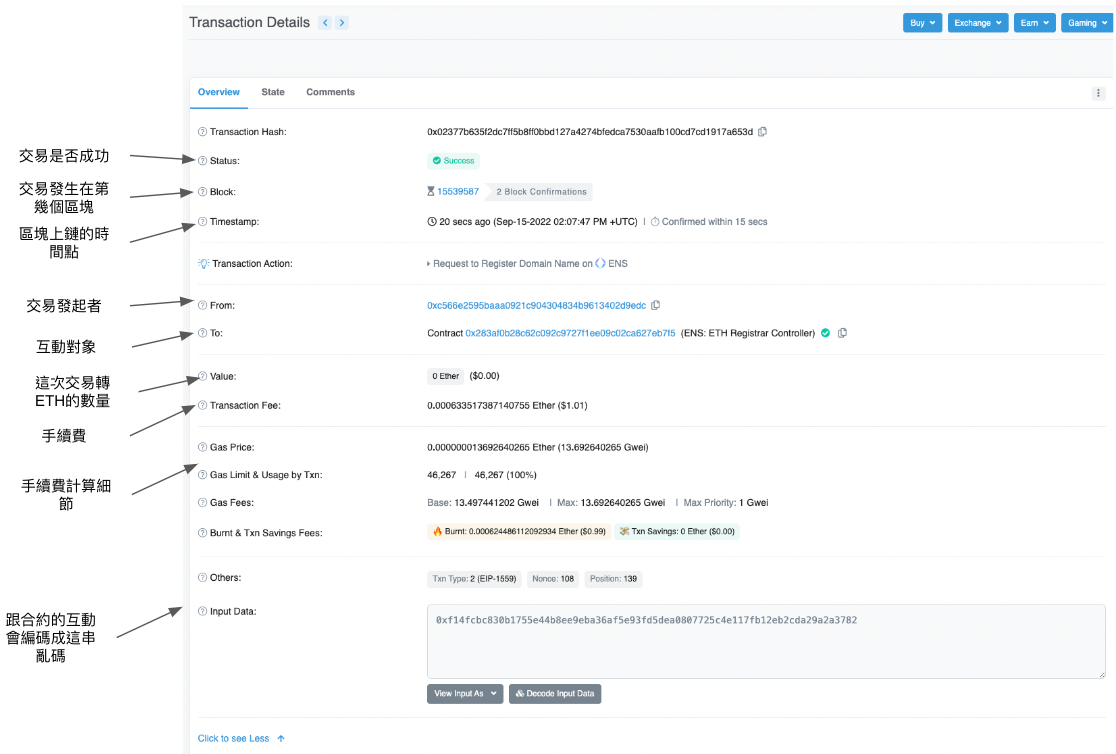
At this time, there is information about the interaction between participants from all over the world and the chain. The next step is to be able to decode the input data (Decode) so that people can understand it. To do this requires having those ABIs for the item you want to decode.
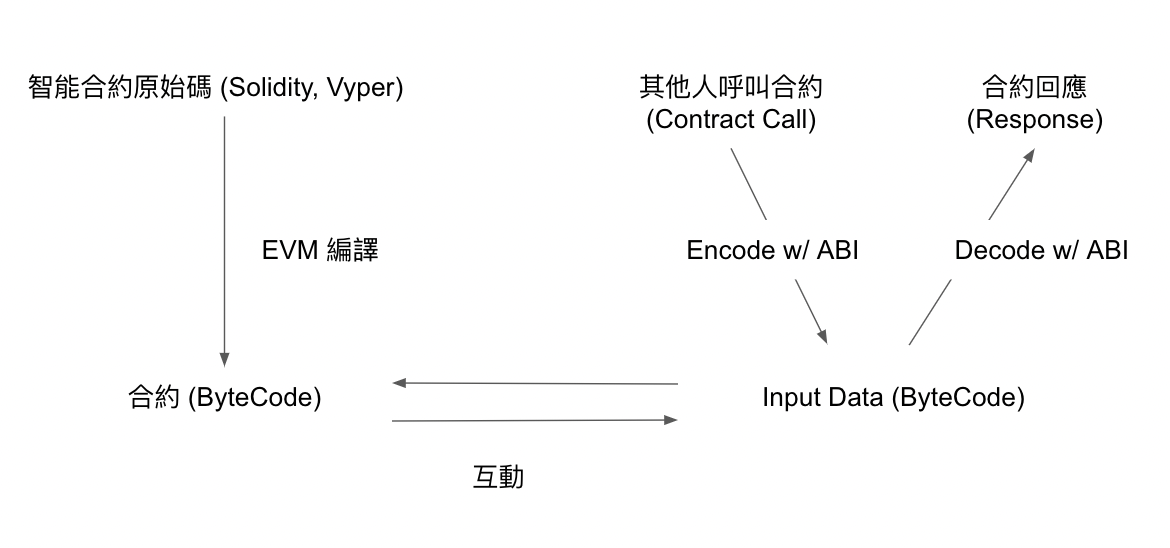
Obtaining ABI needs to be provided by the project party. In addition, if the project party has uploaded Etherscan, you can also use the Ethersan api to obtain a large number of them. Decoding different project contracts requires different ABIs. Therefore, if you are curious about the information of the world's top 100 NFTs, then You will need to collect these hundred ABIs. It was another troublesome and arduous journey, but after decoding it, you can see what interactions have occurred in transcation, and it is a big step forward to analyze the data and find insights.
organising materials
After the data is decoded, it needs to be further organized into an easy-to-use table or database.
Since the data of all the transaction data in the world is in hand when the data is obtained, in this step, the data should be organized into a convenient format according to the requirements, and stored in the database for further analysis.
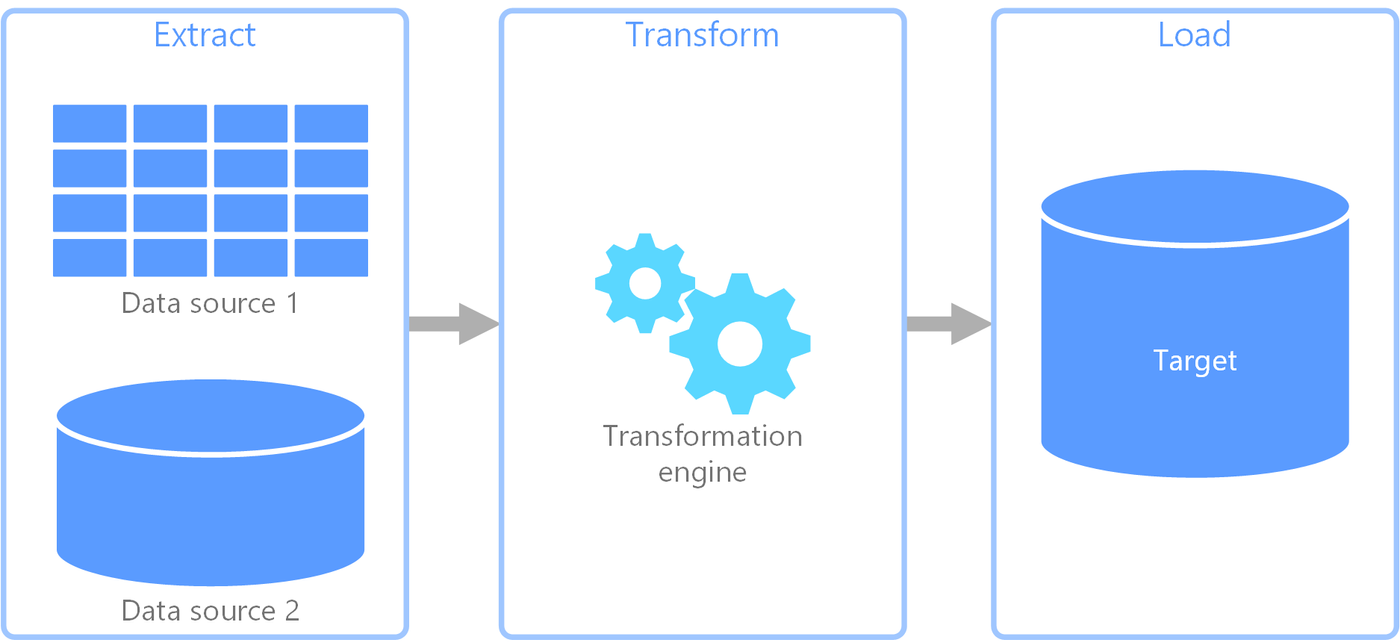
In this step, you can refer to the Ethereum-ETL tool to design the schema according to your needs and organize the data into table data (csv) or relational database. At this point, the data is finally in a usable form!
Data Analysis <br class="smart">At this point, data scientists can't wait to use a variety of statistical and even machine learning tools to extract insights from the collated data, solve their doubts, and test their hypotheses.
Presenting the results <br class="smart">After the analysis is complete, you may want to post your findings on twitter or personal blog, which is indispensable at this time is a beautiful graph that matches your story. Common tools like Matplotlib, plotly can help you.

The above is a process of analyzing the data on the chain from scratch, but the whole process is full of too much trouble and pain. The whole process takes 3-4 weeks, and the final result may be a tweet, or whatever you asked. The question has lost its timeliness. Next, I will share the refreshing experience of making good use of tools.
On-chain data analysis using tools -- Footprint Analytics
Get data & decode data & organize data
You don't have to do it yourself, Footprint Analytics has it sorted.
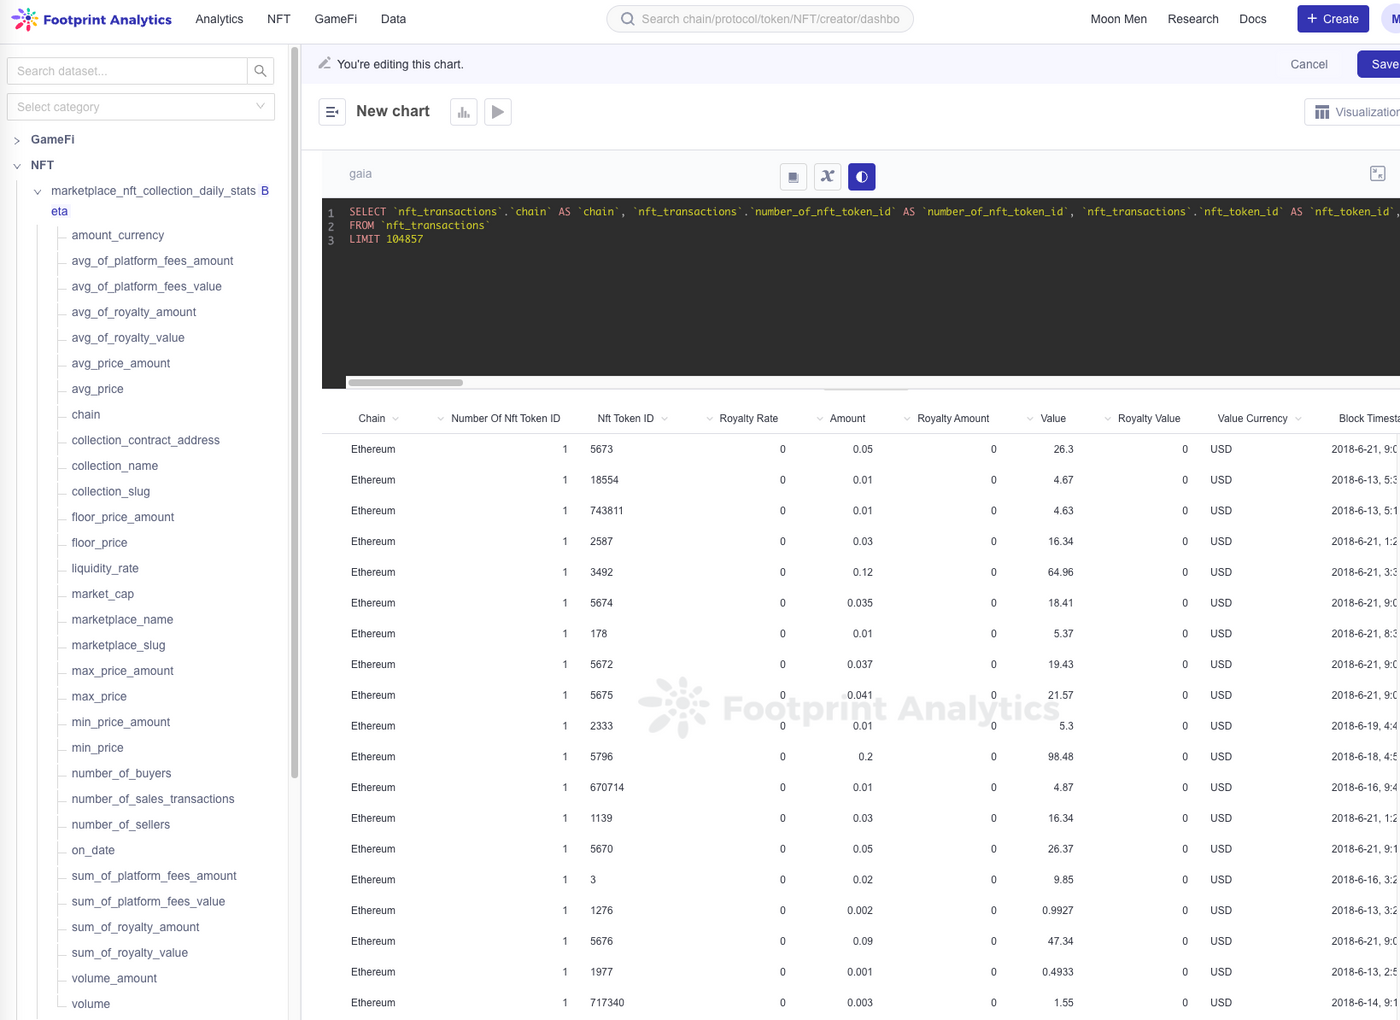
date analyzing
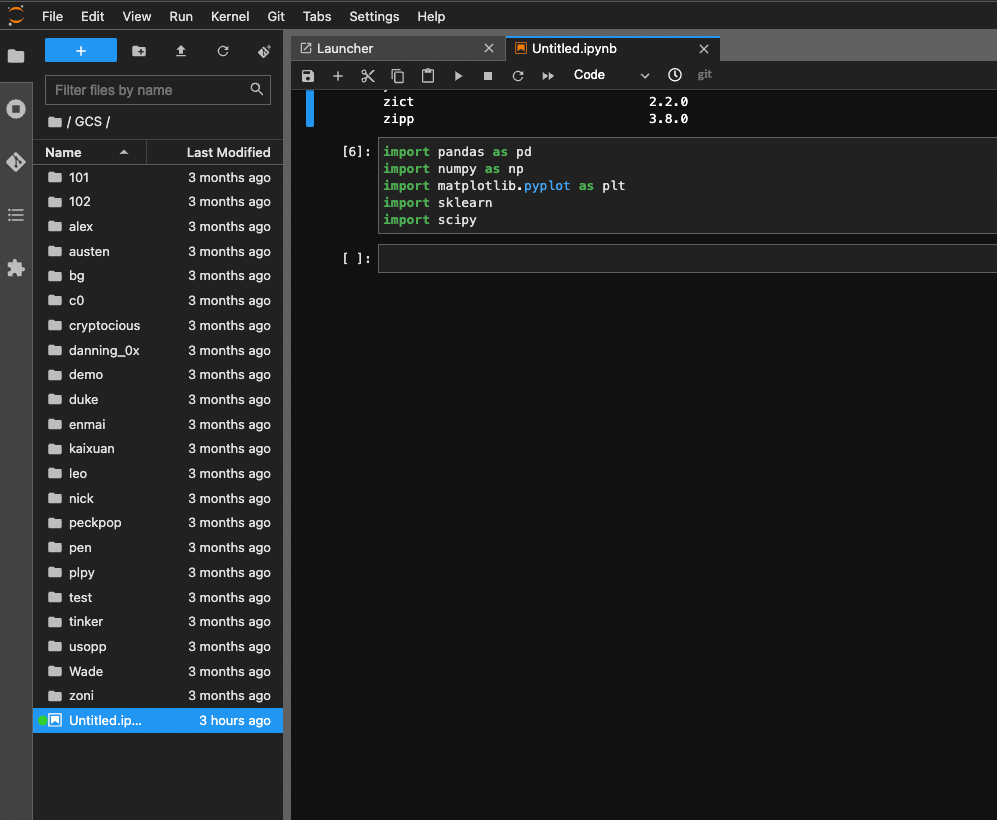
In addition to using SQL commands to calculate some statistical values, data analysis also supports opening a jupyterlab through Playground for data analysis, so that you can use the powerful Python suite to your heart's content! Currently this feature is still in beta, looking forward to better use in the future!
Presenting Results <br class="smart">Building interactive dashboards is easy with powerful built-in features. You can also easily share your results with others, and see what others are interested in and how they started their analysis.
https://www.footprint.network/dashboards

Epilogue
It really took a lot of time to do on-chain data analysis in the early days. Until recent years, such time-saving and easy-to-use products began to appear, which can really save most of the time in data processing and focus on the data analysis itself.
Next, I will continue to share the tools and methods for analyzing the data on the chain. If you like it, please help me appreciate it or leave a message. Thank you for seeing this.
https://www.footprint.network/@motif
Like my work? Don't forget to support and clap, let me know that you are with me on the road of creation. Keep this enthusiasm together!


