Simple things are repeated, how to use moving averages to judge trends and turning points?

In the cryptocurrency circle headed by Bitcoin, the up and down fluctuations in the past few days are extremely large. Bitcoin fell by 14% on 5/19, and the up and down amplitude can reach 29% on the same day. How could such a terrifying decline be the volatility that a currency attribute should have? This is a commodity driven by greed attributes, which nakedly spreads human nature and puts it on the shelf for trading.
Trends and Turnarounds
It may be speculative in nature. Bitcoin is very suitable for using technical analysis to make trading judgments. Let's use Bitcoin to practice technical analysis skills. This is actually quite similar to driving. You can imagine that your goal is to go from Taoyuan to Taipei. This is the north direction. Compared with the stock market, you can call the direction a trend. When you reach Taipei, you will change direction and go down the road. And the action of changing direction down the channel, compared to the stock market, you can call it a turning point.
Therefore, investors need to see the key trends and turning directions clearly. If you can't figure out the trend, it will be like you want to go north to Taipei, but go south. If you don't see the turning point, it will become It was obvious that he was going to talk, but he started too far. In the end, he paid a great price for it.
However, how to judge the trend and turning point? How to judge it?
There are hundreds of kinds of technical analysis. In fact, it is enough to find the most convenient indicator to use. You don’t need to spend a lot of money to obtain the so-called holy grail. We need to practice the focus.
The moving average is long and short
Savage Xianxian, I judge the technical indicators of trends and turning points are mainly moving averages, supplemented by KD.
The moving average is mainly used by me to judge the trend. We know that the moving average is the average transaction cost of investors for a period of time, and the price revolves around the up and down of the moving average. (120-day moving average) The moving average has a certain directionality, that is, it tells us whether the current trend is north (bull) or south (bear).
Understanding the direction of the trend is the first thing we must learn on the way to investing. Once you understand the direction of the trend, you will know where you are now. You can choose to go long or short, and you will be more confident and will not be affected by external news.
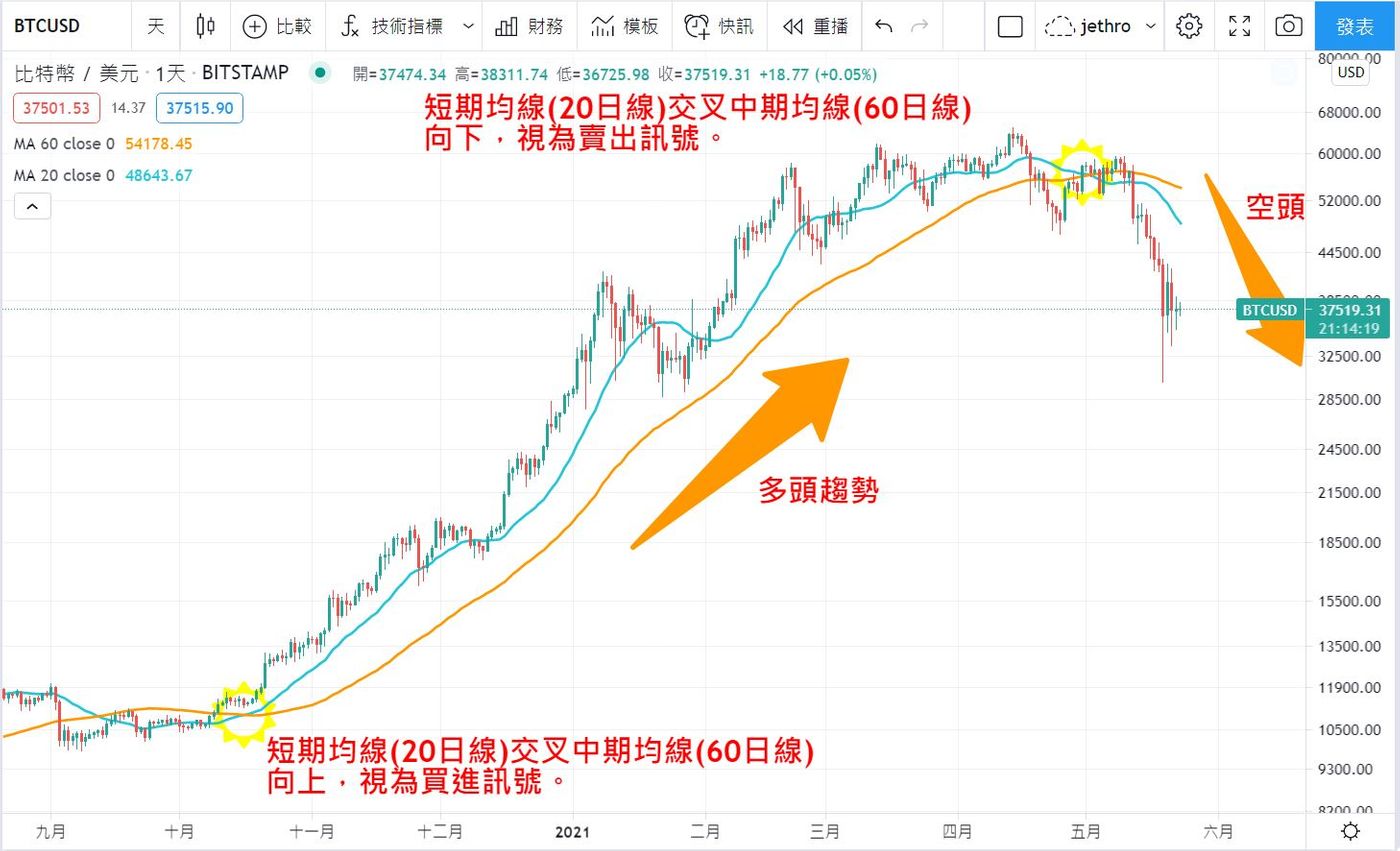
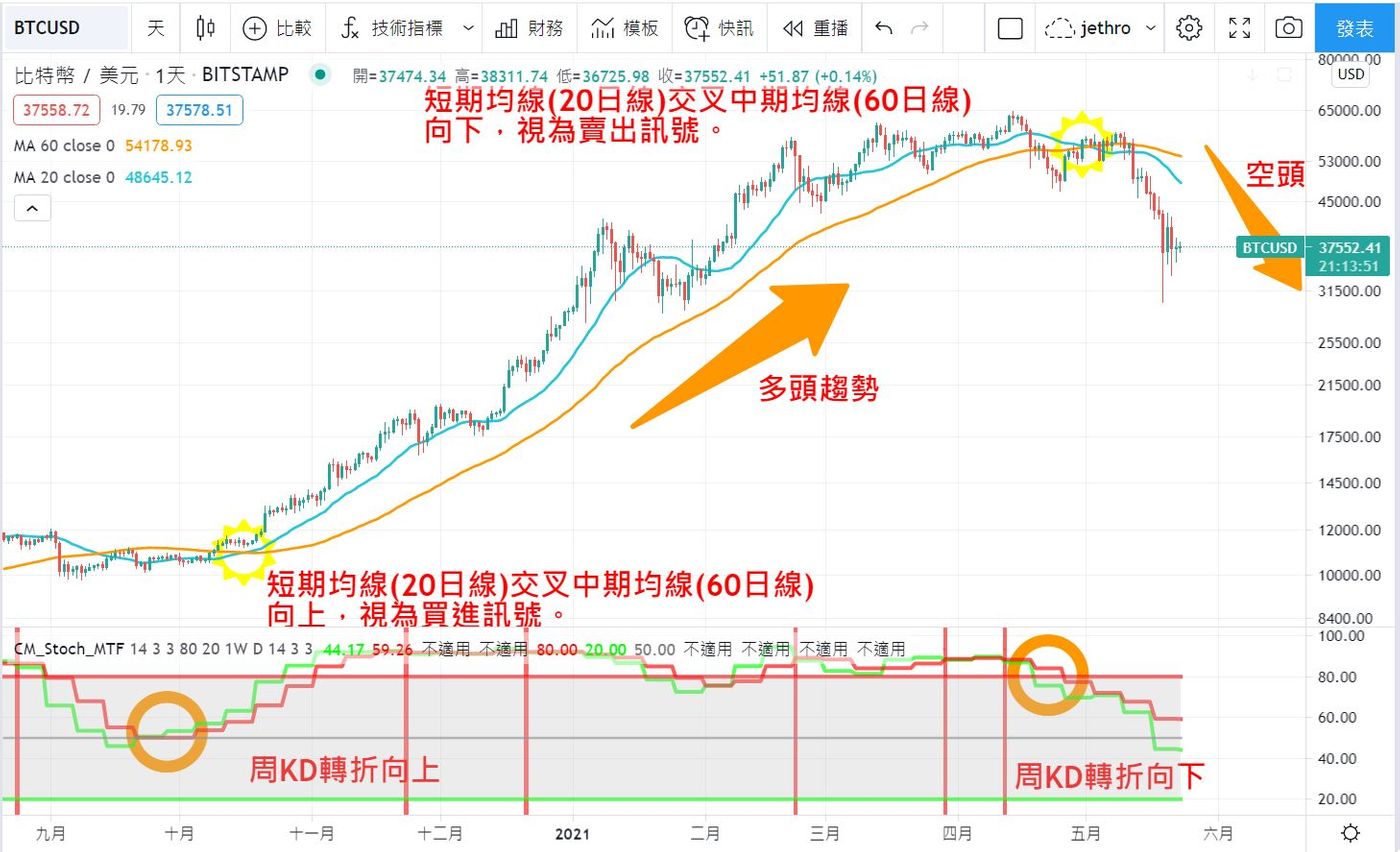
Example: Bitcoin on 2020/10/16, the short-term moving average (20-day moving average) officially crosses the medium-term moving average (60-day moving average), which can be regarded as a buying signal, until 2021/5/2, the short-term moving average (20-day moving average) ) has officially crossed down the medium-term moving average (60-day moving average), which can be regarded as a sell signal.

This is based on the crossing of the double moving averages to determine the buying and selling points, which is very suitable for long or short positions with obvious trends, but once encountering an unclear long and short consolidation, it will be distorted due to frequent crossings and unclear signals.
The lifeline of the stock market
We say that the quarterly line (60-day moving average) is the lifeline of the stock market. Therefore, the quarterly line can be used to judge long and short positions. Once the stock price stands on the quarterly line (60-day moving average), then let the short-term moving average (20-day moving average) cross the medium-term moving average (60-day moving average). Daily moving average), which means that the bullish trend is about to start. At this time, we can buy. During this bullish trend, if the stock price falls below the short-term moving average (20-day moving average), we can sell a small amount of stock in time. If the stock price is only normal The shock of the stock price, and then it will stand on the short-term moving average (20-day moving average). We can choose to buy back the stock again, or not buy it again. If the stock price cannot stand above the short-term moving average (20-day moving average), it will continue to fall. If the medium-term moving average (60-day moving average), then we can sell the stock in batches until the short-term moving average (20-day moving average) crosses the medium-term moving average (60-day moving average) downwards. Please clear all stocks, because the short trend is coming.
This is my initial way of judging the trend and setting trading points. It may not be suitable for everyone. You can refer to it. My idea is that the moving average is the average investment cost of investors for a period of time, and the price is around the moving average, just like an old man Like a dog, the dog will come back to the old man no matter how it runs around. Therefore, even if the stock price sometimes goes up and down the moving average, it is difficult for us to guess the beating of the stock price, but the trend of the moving average is stable, and we can probably judge. out direction.
The moving average is the average cost of investors over a period of time, so the quarterly line (60-day moving average) is the average buying cost of investors in the past 60 days. Once the stock price reaches the quarterly line, it means that the average investor who bought in the past 60 days is For those who make money, the possibility of continuing to hold more stocks is more likely. At this time, if the quarterly line (60-day moving average) rises, it means that the bullish trend has already started. This is the way to distinguish the trend. Looking at the quarterly line (60-day moving average) If the daily moving average is upward, it is a bullish trend, and vice versa, it is a bearish trend.
Week KD Read Turn
In addition, I use the weekly KD indicator to judge the turning point of the stock price and plan the buying and selling points, because I try to lengthen the trading cycle and use time to make up for the error rate in trading. Once the trend is caught, it can also extend the profit and make Your own performance is better.

When the stock price stands on the short-term moving average (20-day moving average), and the weekly KD crosses upward, although the stock price has not yet stood on the quarterly line (60-day moving average), and the short-term moving average has not crossed the medium-term moving average, we can proceed to the first stage. Then, if the short-term moving average crosses the medium-term moving average smoothly, you can buy in batches, and then hold until the stock price falls below the short-term moving average (20-day moving average), and the weekly KD crosses downward. Sell in batches until the short-term moving average crosses down to the medium-term moving average, and after the weekly KD falls by 80, it can all be cleared.
Although technical analysis is very accurate in hindsight, and it is easy to analyze and explain, but at the moment of making a decision, it is always confusing. Therefore, these simple and seemingly easy things always have to go through Time is constantly quenching the chain, sharpening a sword in ten years, I heard that this is how kung fu is practiced. Encourage each other.
Further reading:
1. Simple things are repeated, how to use a moving average to avoid stock market disaster?
2. Regular fixed deposit index ETF is the salvation of retail investors.
3. What is a moving average? If you want to understand the trend, look at these 5 moving averages
Disclaimer:
The information provided on this website is for reference only, and is not intended to recommend trading. Investors should bear the trading risks themselves.
Like my work? Don't forget to support and clap, let me know that you are with me on the road of creation. Keep this enthusiasm together!
