Increase your odds of buying and selling TSMC with stats
foreword
The author, I am a person who likes to do research and tell others about my results. At present, many professional skills are almost learned by myself. At the end of 2008, I decided to buy an iPhone before it was ready to go on sale in Taiwan. I use black apples for research and development. In order to successfully write software, I practice day and night. After the software is completed, I want to put it on the shelves, so I put my own program on the shelves shortly after the Taiwan side published it. I hit this trend by mistake. I seized the opportunity and accumulated some income for myself, but I ignored another big trend. If I invested my savings in Apple stock in 2012-2013, my assets might accumulate a lot.
When I went to Long Stay in Europe in 2019, it was so cold in winter that I wanted to plan my return trip in advance. At this time, I listened to the radio on a whim to increase my language skills. People are lazy and listen to almost all Taiwanese programs. After watching a lot of financial-related programs, I realized that for the past ten years, I have felt that stocks are too expensive. I have to wait for him to crash before buying them. I need to start researching stocks.
I plan to return to Taiwan after the Chinese New Year in 2020. The new crown pneumonia broke out before the Chinese New Year. During this time, I have been paying attention to whether the pneumonia will affect the flight between Europe and Taiwan. I returned to Taiwan smoothly in early March, and I came back to Taiwan about 2-3 Pneumonia broke out in Europe this week. At this time, I can say with certainty that Europe has fallen, and it is only a matter of time before the US has fallen due to frequent exchanges between the United States and Europe. It is only a matter of observing social phenomena, but does not combine social phenomena with the economic environment. Later, U.S. stocks plummeted, the FED released the largest QE, and the stock market surged again, all of which are closely related to economic activity.
I started to read and absorb a lot of financial knowledge every day, what stocks to buy and how to operate stocks, I still refer to others a little more. Evergreen buys in the thirties, but I can’t judge the container shipping, and sell it at -2x%. Global Crystal sold for only a few ticks, but it more than doubled. Kecheng made a small profit when it went up, but didn’t sell it when it pulled back because the market was long, and in the end it didn’t make a profit. Sinosteel bought when it broke through, but it still pulled back, and finally broke through and earned 30-40%.
Every transaction is an important learning for trading. Evergreen knows that high volatility and high risks are high before buying. The left-hand trading skills are not good enough to be easily washed out; short-term trading risks are high, but long-term trends are ignored; the judgment of strong stocks and weak stocks I learned from Kecheng stock that weak stocks Kecheng will rise when they are long, but they will give priority to falling back. When the risk increases, they need to be cut regardless of whether there is profit or not; Even though it finally broke through and rose sharply, such an operation still needs to be reviewed. In the end, I didn't earn or lose, but I learned a lot.
In the end, it’s good to shout about valuations when you are long. Stocks have become very expensive, and valuations can be corrected to normal levels in just three to six months. Financial news is bad news almost every day. How should I invest in 2nd grade at this time, I can't give an answer, the only answer is to use statistics to increase the winning rate of buying and selling stocks.
Data Sources
Transaction data: [Taiwan Stock Exchange]( https://www.twse.com.tw/ )
Financial report data: [Public Information Observatory]( https://mops.twse.com.tw/mops/web/index )
Daily transaction statistics period: 2004–02–11 ~ 2022–08–04
Financial Statement Statistics Period: 2012Q1 ~ 2022Q1
Statistics for reference?
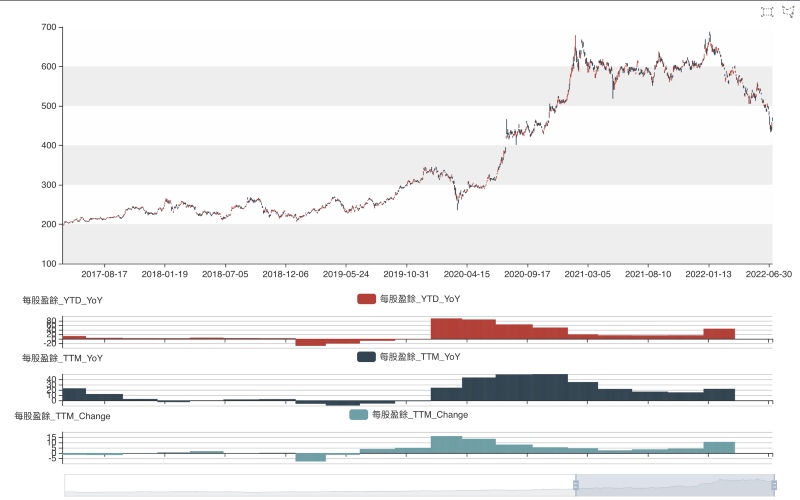
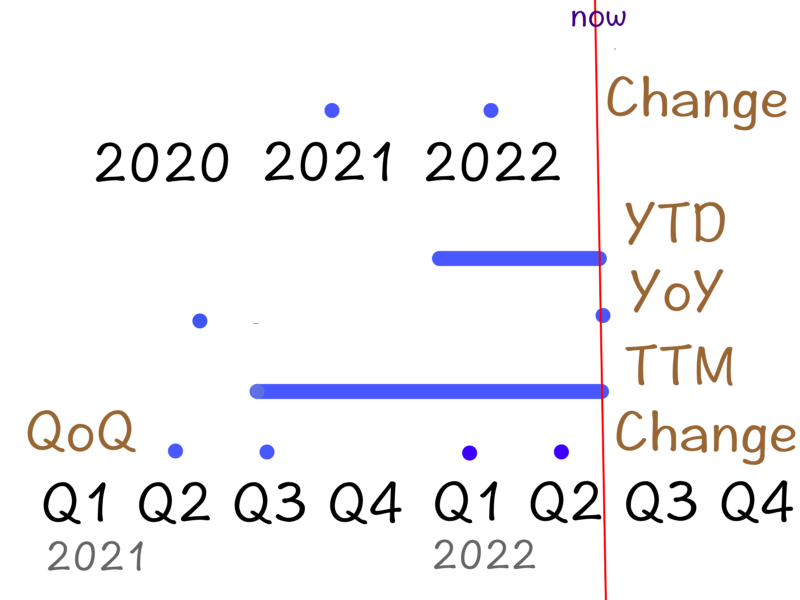
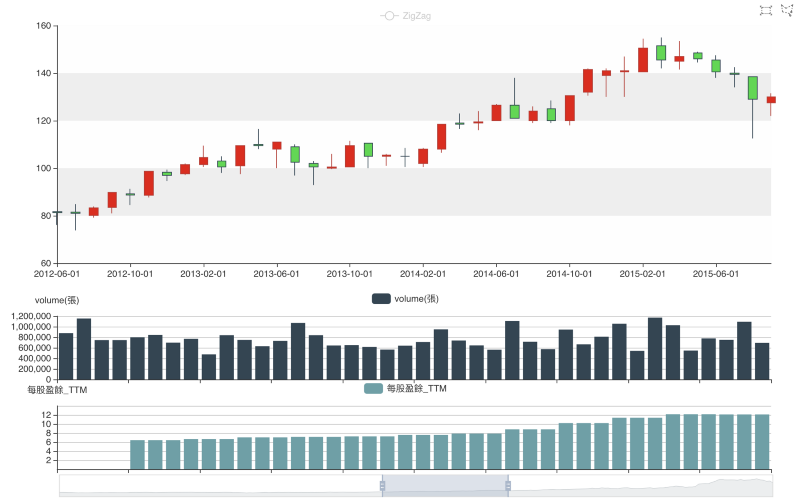
Let’s first take a look at TSMC’s daily chart and earnings per share chart. Earnings per share use different statistical time to calculate different values. TTM accumulated in the last four quarters, YTD accumulated earnings in the current year, YoY annual growth rate, and the percentage of data change each time Change , see the illustration below.
This chart shows the fluctuation of TSMC's earnings and stock price. The three data earnings growth rates can all be correlated with the stock price. Only the growth rate is a single data, and different statistical methods can already be used. It can be divided into three types of data, **quarterly** earnings per share (Q1, Q2, Q3, Q4), ** last 12 months** accumulated earnings per share (TTM), ** current year** accumulated earnings per share (YTD), so there will be various combinations of earnings growth rates. When referring to data, it is necessary to understand the meaning behind the data and how it is generated. Only these indicators or statistics can help us make the best judgment when buying and selling stocks.
Everyone is an expert with historical line graphs
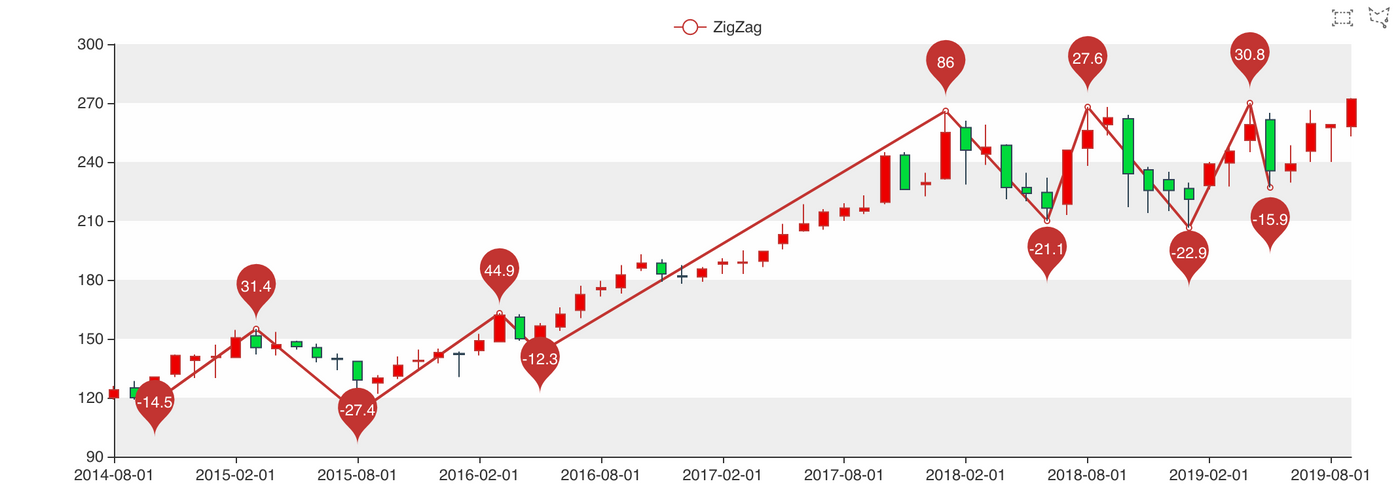
Switch to the TSMC monthly chart, where the ZigZag indicator is added. The calculation method of the ZigZag turning point indicator is very simple. As long as it is greater or less than 10%, a turning point will be generated.
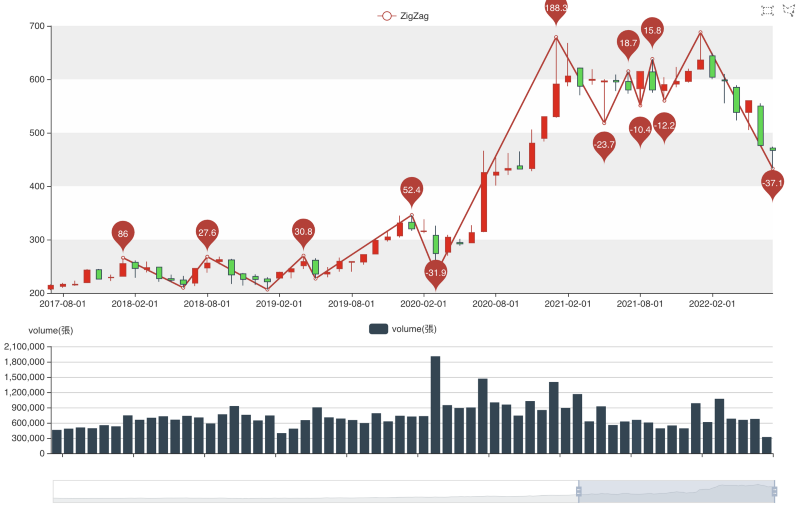
Take the time to the max, and with this picture, everyone can find a good buy, but is that the case? I'll just pick a time in August 2015 to see...
In 2015, it rose 31%, then fell 27%, and then rose 44%. These three waves rose and fell for about 6-7 months each. Using this monthly chart, even if you are not an expert, you can tell the best buying point. Is this really the time to buy when it is falling?
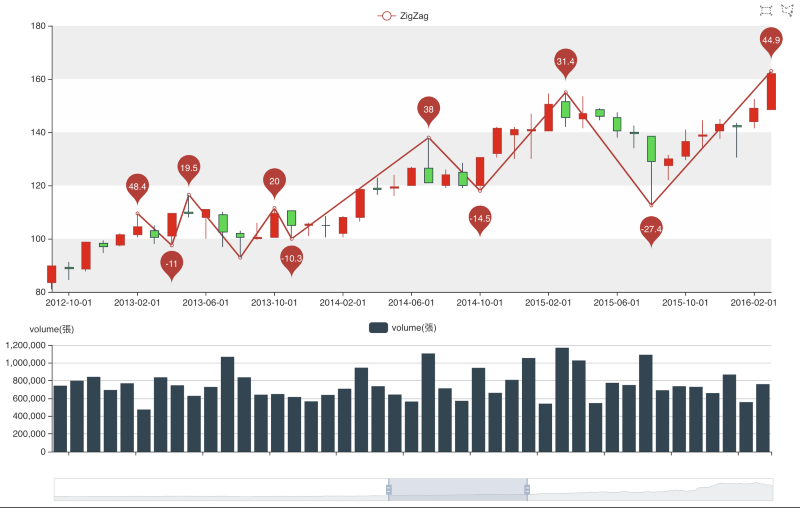
Replace it with a line chart that can be seen in reality. After the cumulative decline of 27% in the last month, the stock price will rise or fall. No one can predict the result with 100% accuracy. (At that time, it was all bad news, and good news was also negatively interpreted, just like the current stock market.) Investors who dare to buy at this time must have their own way of operating.
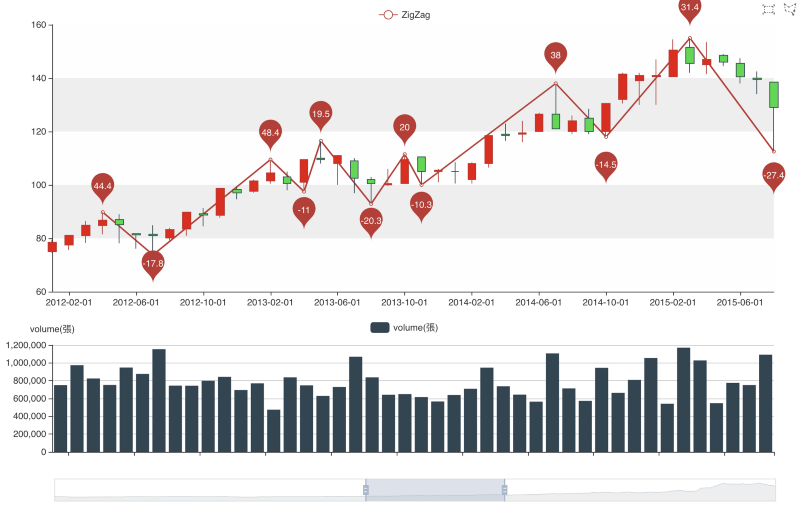
Looking at the monthly chart, and then at the daily chart, it fell in August 2015 and rebounded after breaking a new low. At this time, should we wait or buy?
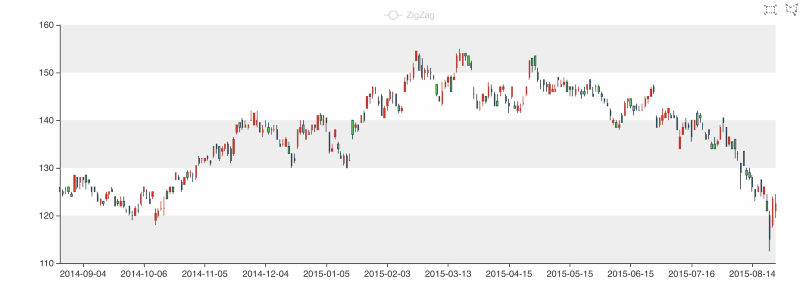
Determining growth stocks or cyclical stocks
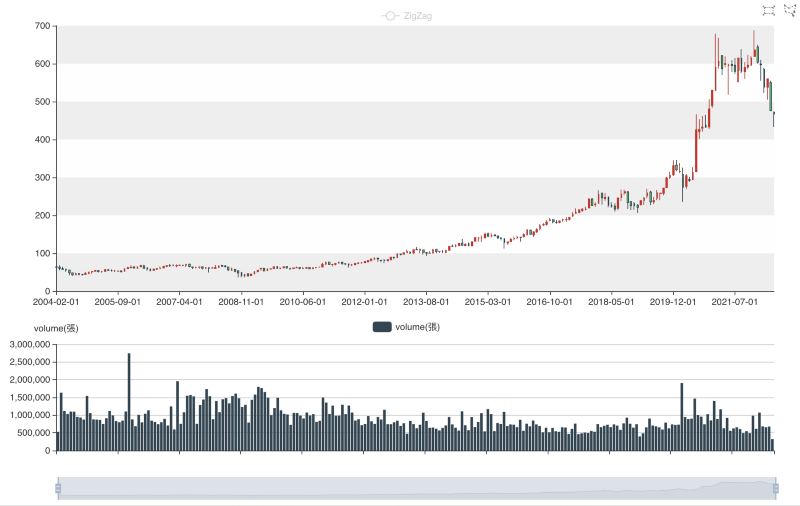
Now switch the time to 2004. The line chart tells me that from 2004 to 2010, the stock price fluctuated between 40 and 70 until it broke through to 75 in December 2010. At that time, did TSMC become a growth stock? It is not enough to judge in just a few months. More information is needed to make judgments. The data currently in hand has only financial statistics after 2012, so it can only be seen that TSMC's stock price fluctuation trend has changed.
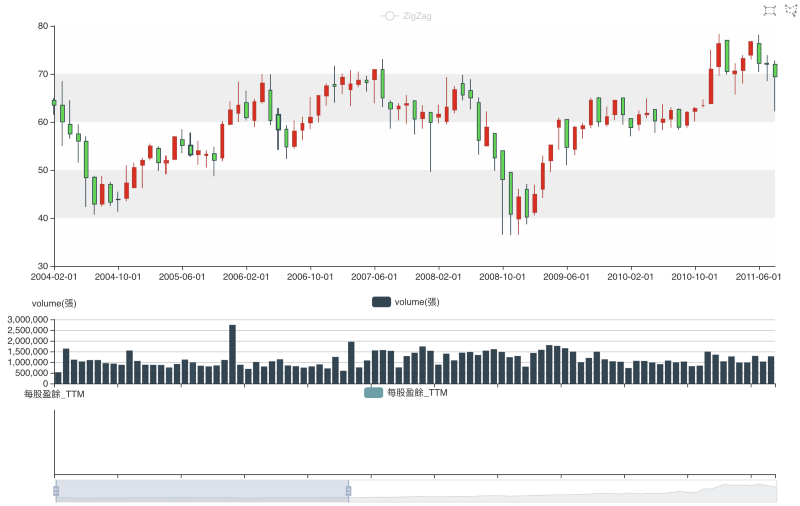
Switching the time to 2012 again, the 2012Q4 ~ 2015Q2 EPS were 6.4 and 12.1, respectively, and the earnings and the stock price increased by about 40-50%, which can show the real growth of TSMC. At this time, TSMC was a standard growth stock. Looking back at that time, I only considered that TSMC was twice as expensive as before. The results have been waiting for almost ten years. As long as you are willing to spend time researching, you will definitely have similar judgments. These are the results accumulated through learning. Don’t just stretch out your hand and ask a certain stock whether to buy or sell. These are the results. questions are to ask yourself.
general economy
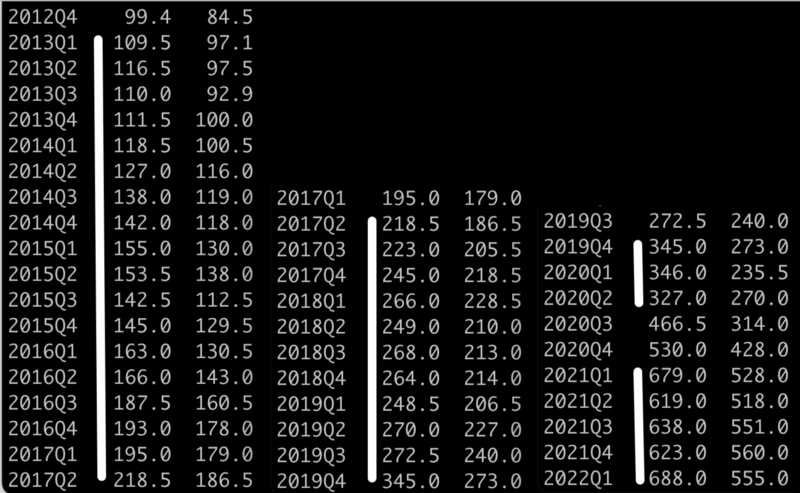
Next, through the quarterly data, the left and right are the highest price and the lowest price of the current quarter, and the stock price of TSMC will be analyzed. About one year later, the stock price will accumulate to the next 100 yuan price. From 2017Q2 to 2019Q3, the price of 300 yuan broke through to 400 yuan in only three quarters, and the price of 4500 yuan only took one quarter to break through. Why will this happen in 2020-2022? In 2020, I told a friend to invest in stocks. The reaction of my friend was the same as that of most people. The reply said that everyone he knew lost money. Stocks are not a good investment. Buying a house is a better choice, etc., but a few When we met again a month later, friends who said they would not buy or sell stocks also started to buy and sell stocks, and the reason was that colleagues could make tens of thousands of dollars at a time and so on. This is the rendering power of money. People who make money will keep saying that if they make money, they will lose money. As for those who lose money, they will drown in this tide of money and completely ignore the risks.
The FED has the largest monetary easing in history in March 2020, so many people use high multiples to buy and sell stocks or cryptocurrencies, and some people lose out on the rich. Remember that the shorter the line, the more like gambling, and the easier it is to use high multiples. pay back. It is under this atmosphere that the number of securities account openings has reached a new high, and the daily transaction amount has repeatedly hit new highs, so TSMC is also prone to creating different transaction data.
Monthly Chart vs. P/E River Chart
When I want to try to calculate the price-earnings ratio river chart by myself, the statistical period uses both monthly and quarterly, and the price uses the closing price of the last trading day of the statistical period. When I see the monthly chart is very similar The price-earnings ratio river chart, so the opening, the highest, the lowest and the closing price are added. In fact, the price-earnings ratio river chart is a monthly chart. I think the most important data of the price-earnings ratio river chart is the algorithm of the price-earnings ratio multiple. The price-earnings ratio river chart of major websites only provides a range, and the reference monthly chart is more valuable. At this time, I am thinking about how to calculate a reasonable and valuable price-earnings ratio multiple.
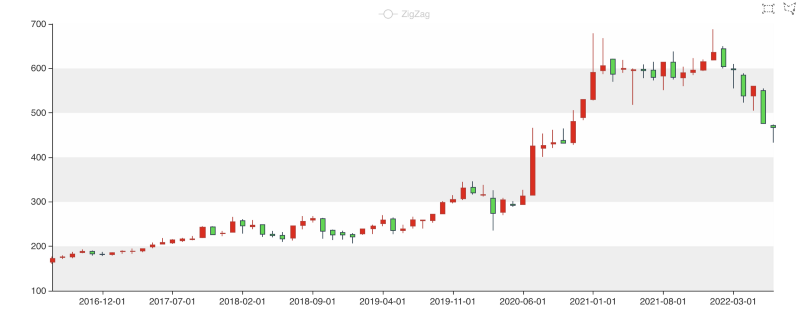
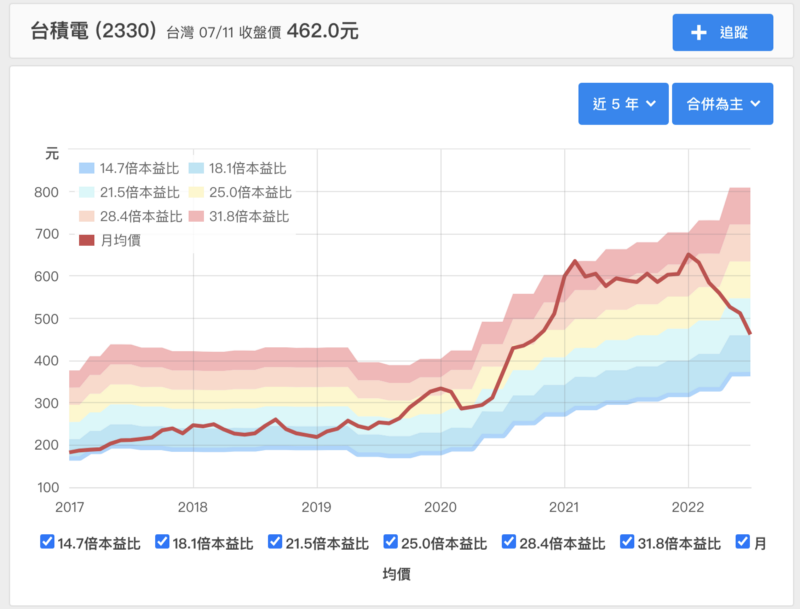
Image source [Financial Report Dog] ( https://statementdog.com/analysis/2330/pb-band )
back to reality
The above is history and can only be used as a reference. As for the future TSMC, how should it be viewed? Looking at the monthly charts in recent years, I will have the following questions and opinions on TSMC as a company
1. Will it still grow?
2. The price in July 2022 is about the price of 2020 two years ago, so is it cheap?
3. Since March 2020, it has risen by 188%, and then fell by 37%. Has there been such a thing before?
4. Is the current valuation reasonable?
The more questions, the more accurate the verification, and the easier it is for the invested company to survive adversity, but it does not mean that it will definitely make money! There are many more minor issues below (I am for TSMC)
1. Who is the general manager or chairman
2. Competitors
3. Real profit and fake profit
4. Profitability
5. Operational performance
Will it still grow?
Please make your own subjective judgments, no one can predict the future accurately 100%. I believe that TSMC will continue to grow in the short-term 3-5 years. The next problem will be the physical limit after shrinking to the limit, and what the result will be is currently unpredictable. On August 2nd, I heard a professional industry interview on Financial Report Dog's Podcast [Panquan Technology Talks Semiconductor] ( https://statementdog.com/blog/archives/12796 ), which deepened my understanding of foundry, TSMC every day They are all working hard for the new process in the next year or two, and the future revenue will depend on the growth momentum exchanged by these R&D personnel working day and night.
July 2022 prices are about two years ago in 2020, so is it cheap?
This premise is that I believe that TSMC will continue to grow, so the current price has returned to the normal price, which is relatively cheap. Think about the start of unlimited QE in March 2020, and under the influence of the lack of recovery materials, enterprises Profits have increased, and companies that do not make money can raise a lot of money with high valuations. The market for high-growth companies has given a very high price-earnings ratio, and TSMC's price-earnings ratio has also reached the historically high price-earnings ratio range. Monthly corrections are back to normal levels.
It rose 188% from March 2020, and then fell 37%. Was there anything similar before?
In 2015, there was a similar situation. It started to rise in September of the same year, and the highest was more than doubled, and the retracement was only 2x%. This is only for reference in history.
Is the valuation reasonable?
This condition is the most important in my opinion. In July 2022, Chunghwa Telecom's PE ratio is 24-25 times. I think the price-earnings ratio of 25 times is too expensive and not worth buying. The calculation of valuation adopts the simplest method: reasonable price-earnings ratio multiple * earnings per share = reasonable share price . TSMC's price-earnings ratio multiple is calculated by calculating the daily price-earnings ratio multiple based on the daily closing price of the transaction and the EPS of the most recent 4 quarters. After removing the decimal point, it is only rounded up. Finally, the price-earnings ratio multiple is used to calculate the frequency of occurrence.
The frequency distribution of price-earnings ratio multiples is shown in the following chart, which is simple and easy to understand. Finally, several times of the price-earnings ratio should be used to calculate a reasonable stock price and leave it to the readers to judge for themselves. (Note that there will be different data due to different statistical intervals)
Frequency of occurrence of price-earnings ratio multiples Statistics period: 2012-10-01 2022-03-31
Statistical days: 2326
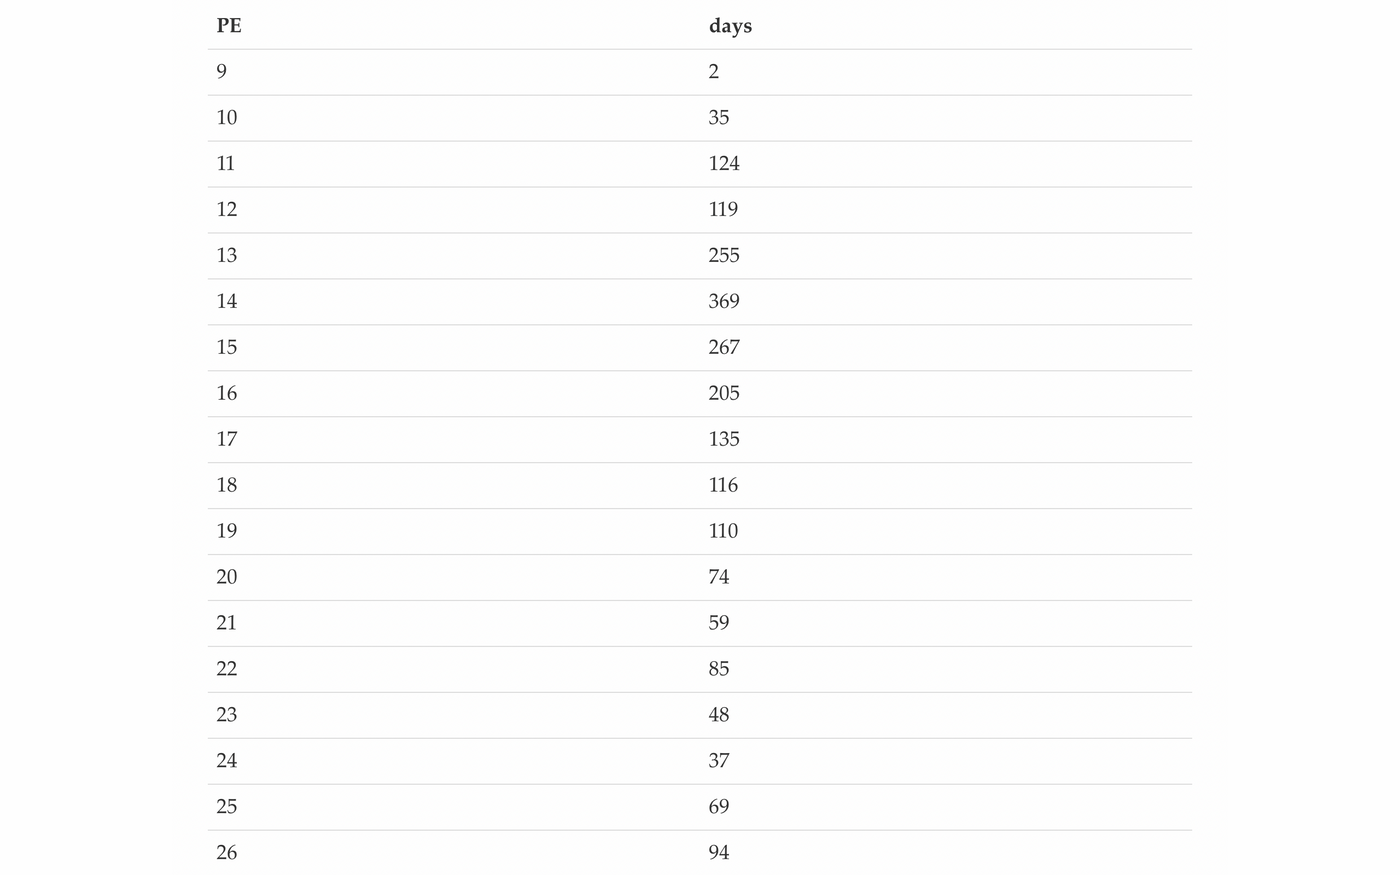

The following table uses the multiples of the price-earnings ratio calculated by the average. There are too many values in this table and it is a bit complicated. It is necessary to use the minimum value or the average, three years or five years... Maybe adjust the data and only take positive multiples, see If you don't get dizzy, the work is left to the readers to do by themselves. Which data to use in the end should be based on your own judgment. Readers who cannot judge, please ask yourself several times. You can find many answers through the Internet. When you can already judge, you can interpret whether the information provided by others is correct or not.
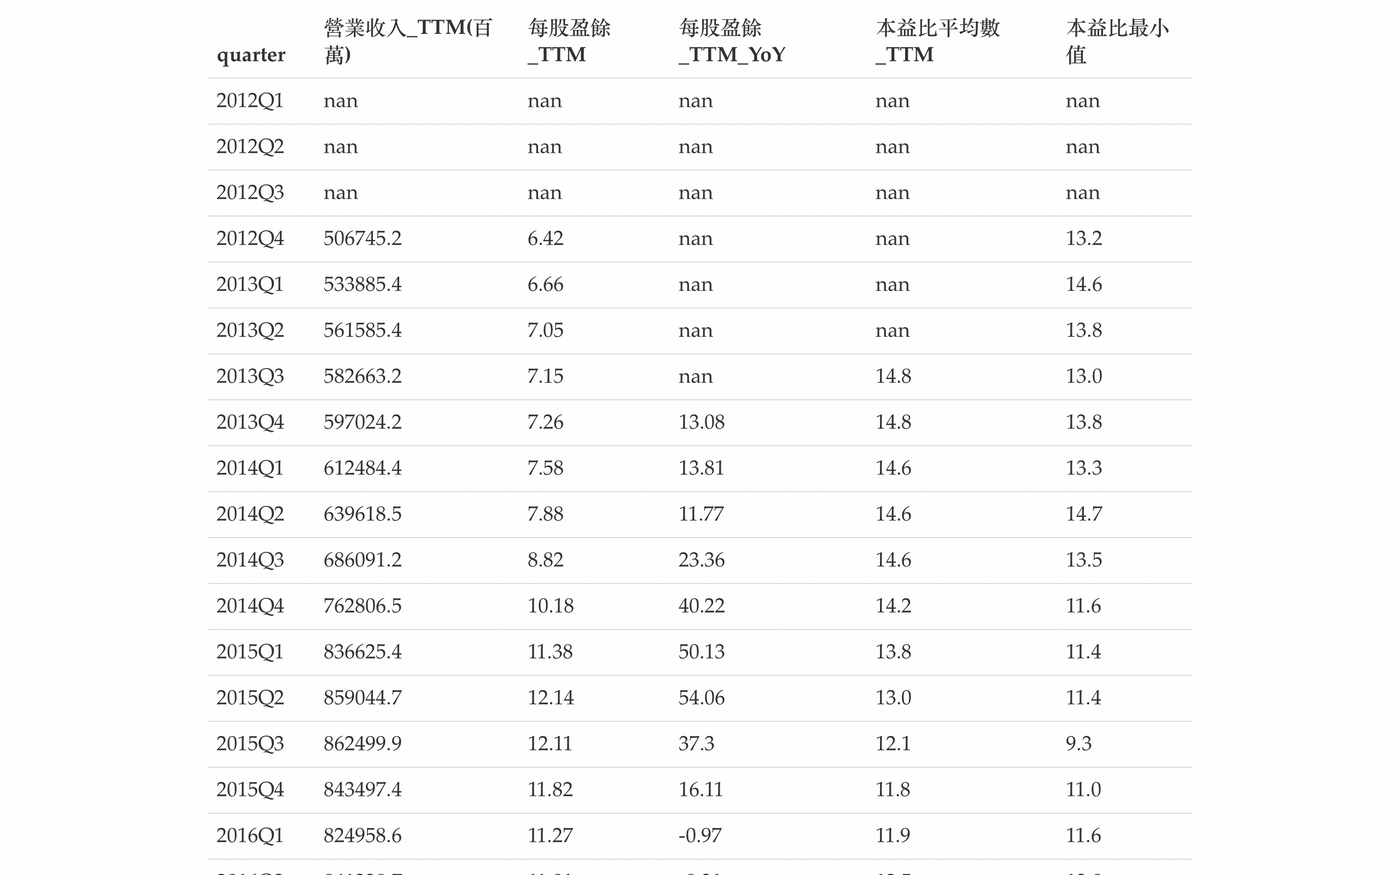
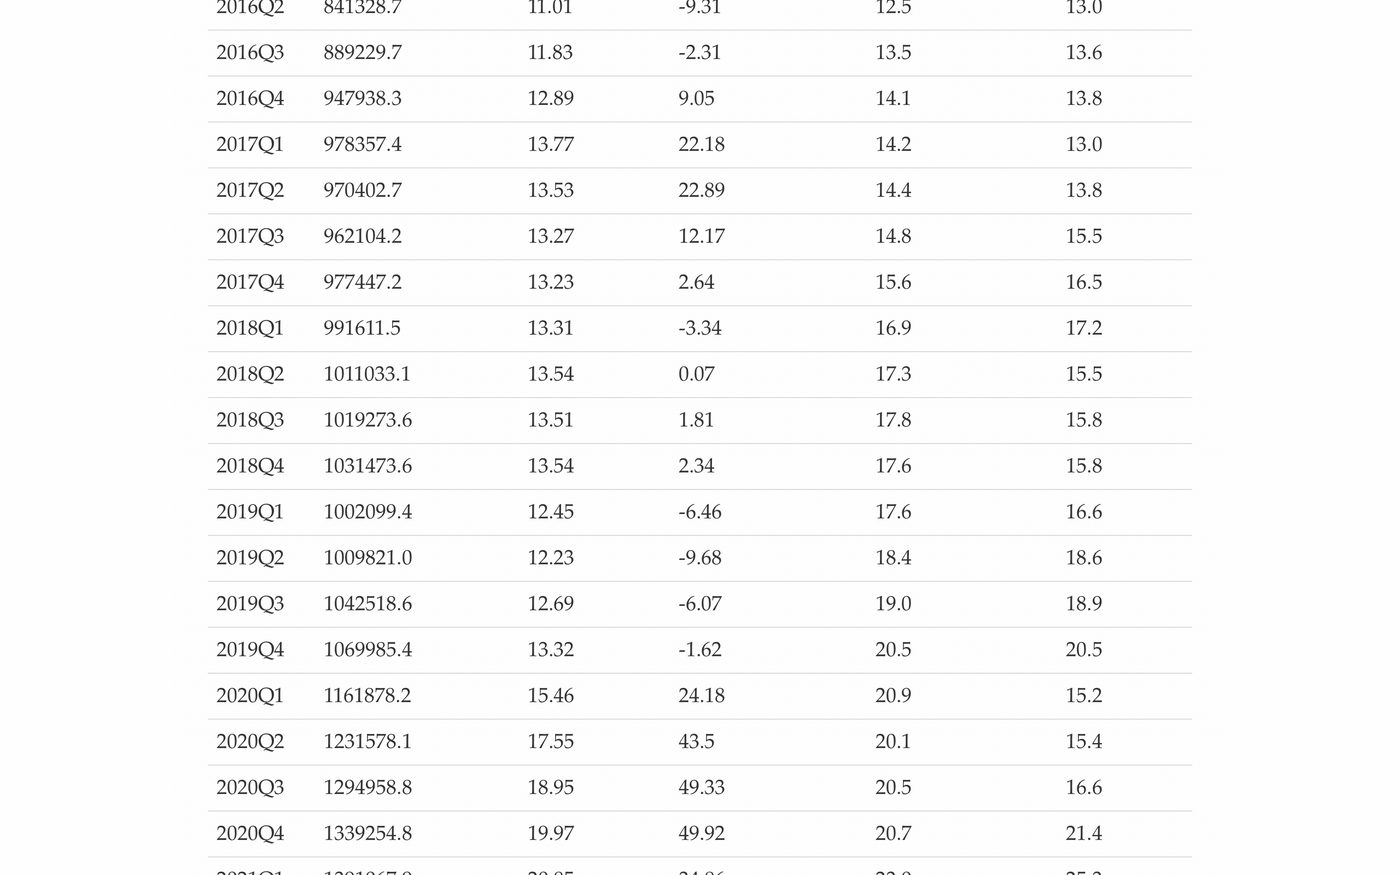

 TTM has an average value per quarter, and then take the average of the four seasons = SMA4
3Year 2019-2021 three-year average, take the average of the four quarters of each year, and finally use the three data to calculate the average price-earnings ratio average of
Real profit fake profit?
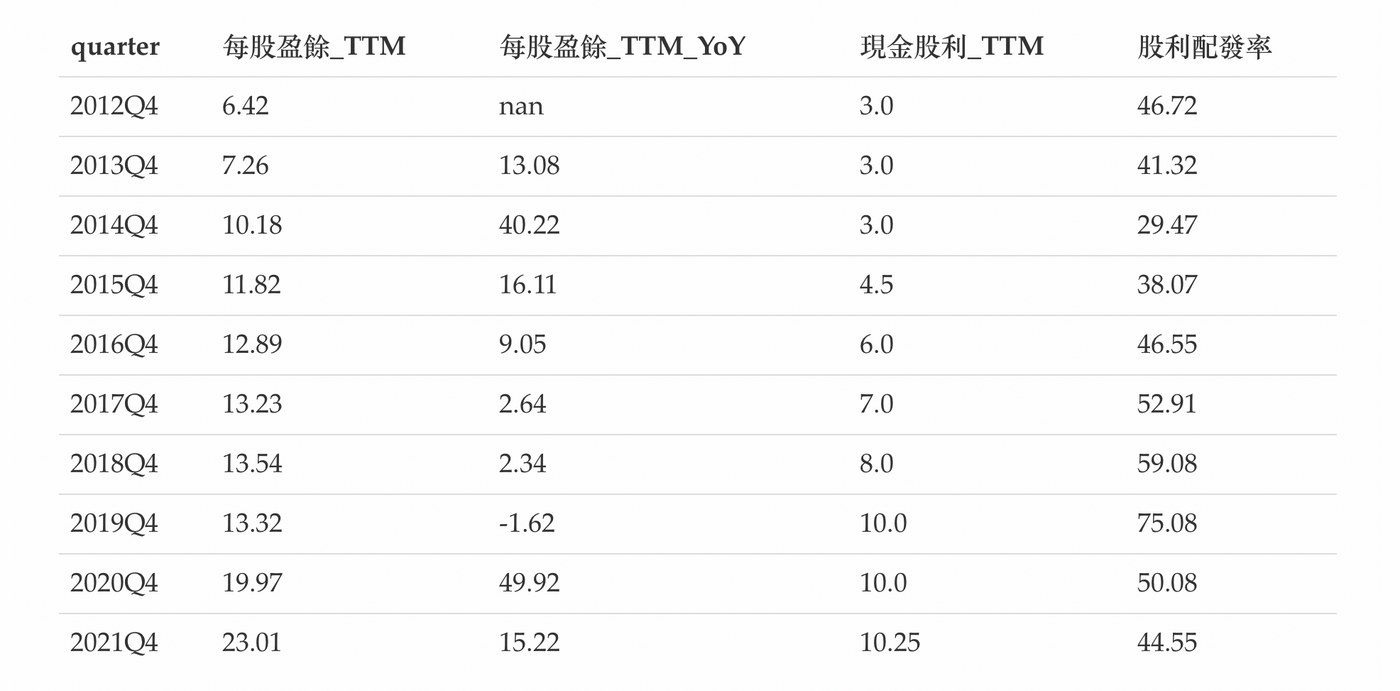
From the annual earnings per share and cash dividend statement of TSMC, it can be found that the money earned is more than the money distributed to shareholders. Several times on record, this company requires special attention before investing. Cash dividends are to use the surplus income to allocate part of the surplus to shareholders, and the excellent management team will create more surplus from the remaining surplus; some management teams in Taiwan stocks will allocate these retained surpluses when they make less money. Distribute it to shareholders; as for companies with bad management teams that cannot maintain long-term profits, they often use the market to increase capital, and then distribute the money to shareholders. In other words, companies that do not make money still have cash dividends every year. **Earnings per share and cash dividends** This is only one of the ways to judge the true and false profits of a company. I, who have little investment experience, can only provide a reliable method at present.
authenticity or reliability of data
The minimum requirements to use the above analysis are:
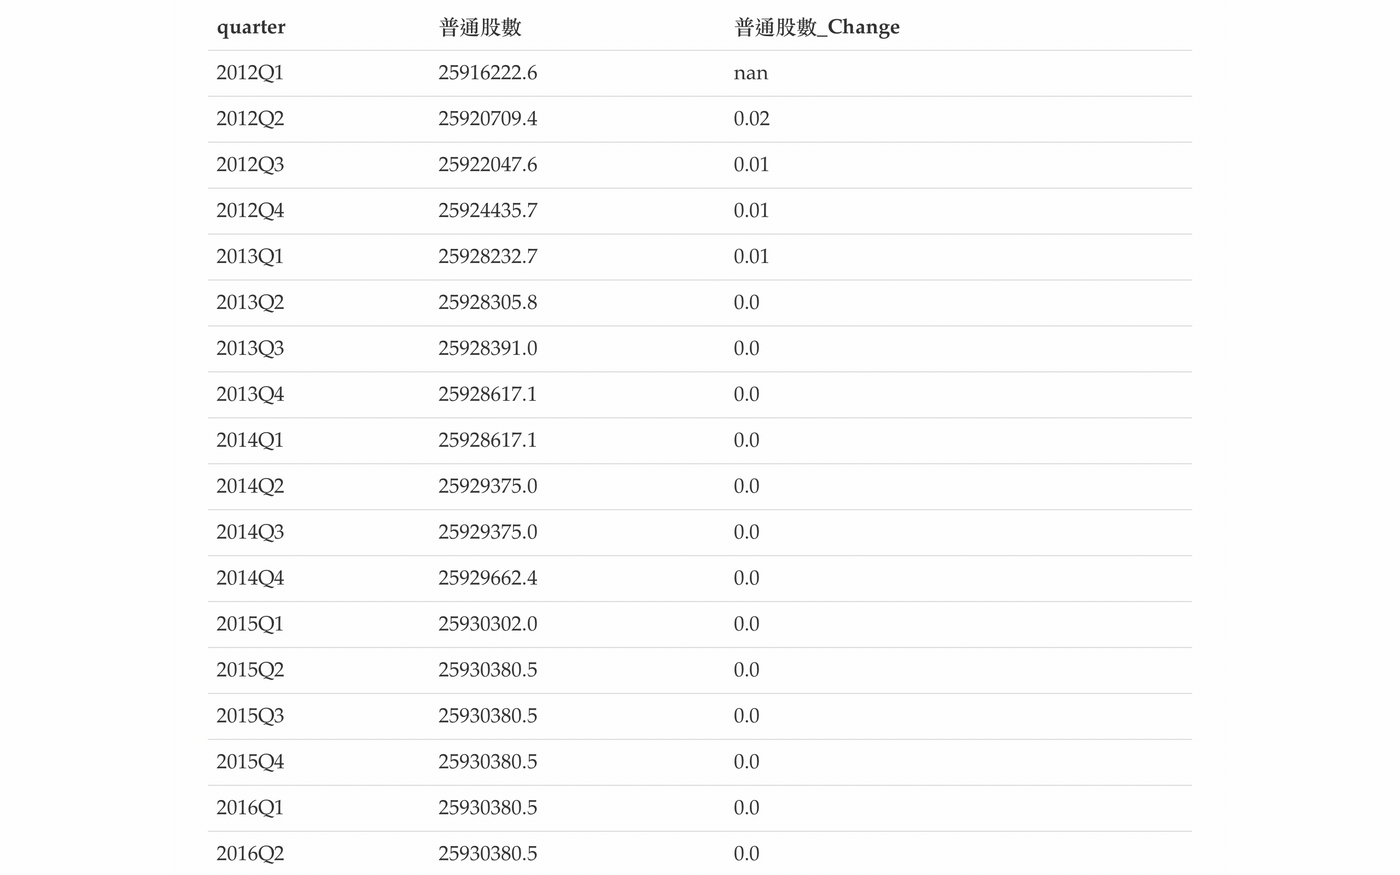
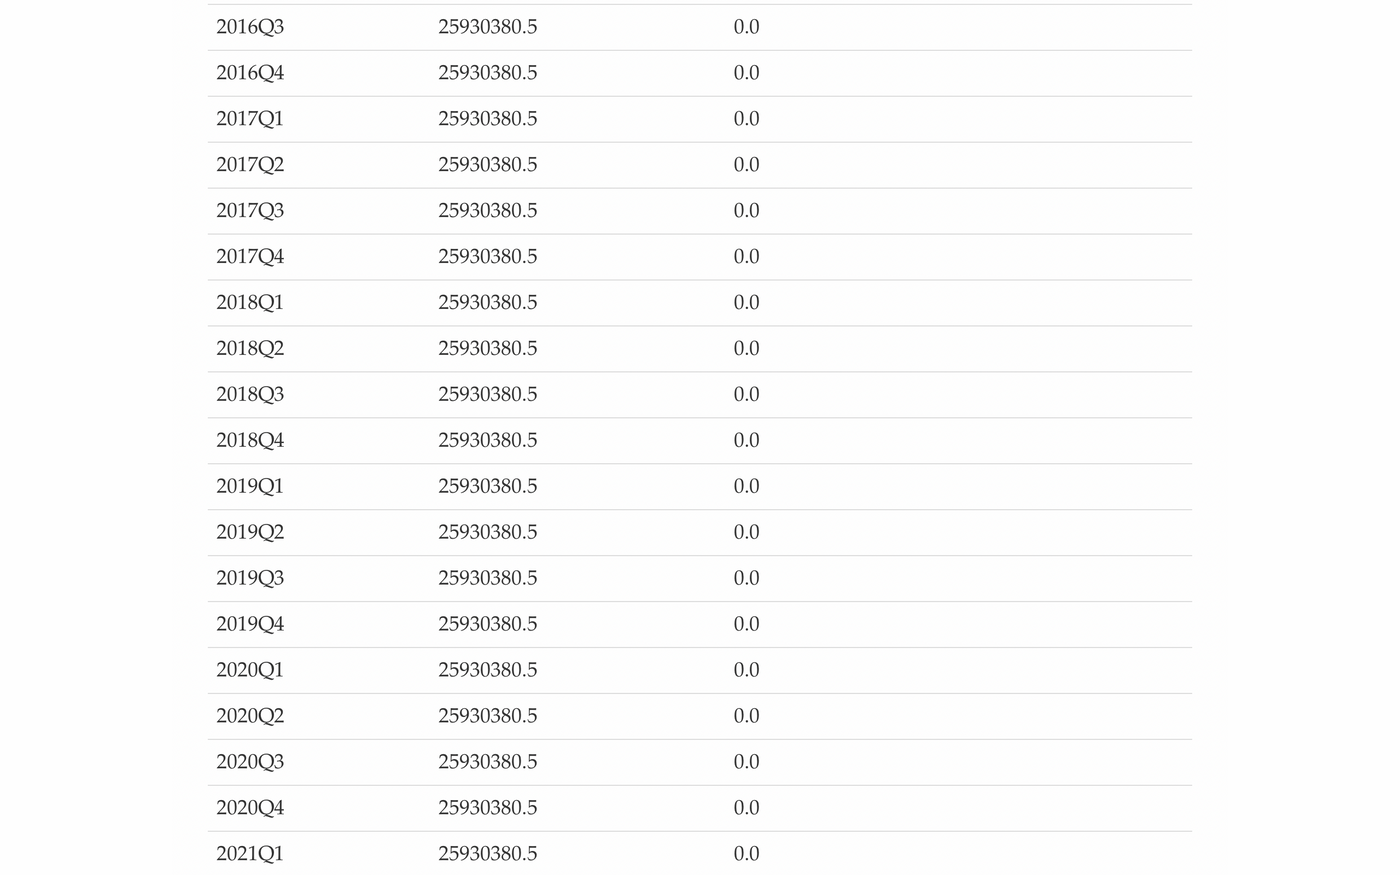
1. The share capital is fixed and there is no capital increase or decrease <br class="smart">When making statistics, the changes caused by capital increase and decrease are not taken into account. Changes in equity will lead to changes in stock prices. This change is linked to a lot of data changes together. Not only the stock price changes, so the major financial websites can provide data, and can verify that all the data are correct. This is a reliable result.
TSMC's common shares (pieces)

2. Stable profit and no loss <br class="smart">Assume a company's Q1 and Q2 earnings per share are 1 and -0.1 respectively, and the stock price is 15,10 respectively
 Q1 PE = 15/1 = 15
Q2 PE = 10/-0.1 = -100
When making statistics, the data of Q2 should be discarded to be accurate, but in this way, although a data can be counted, the lack of quarters makes the data less reliable, so it is only heard that companies with unstable profits use stock prices. Equity ratio, that's why.
Can you answer these questions?
1. Can you identify scams and fake investments?
2. Which of 0050 and 0056 performs better?
3. What are the differences between ETFs, stocks, stock futures, index futures, and funds?
4. Are cash dividends the same as profit?
5. The high-yield myth?
Note that all are questions and answers!
2412 Chunghwa Electric
Statistical period of frequency of PER multiples: 2012–10–01 2022–03–31
Statistical days: 2326
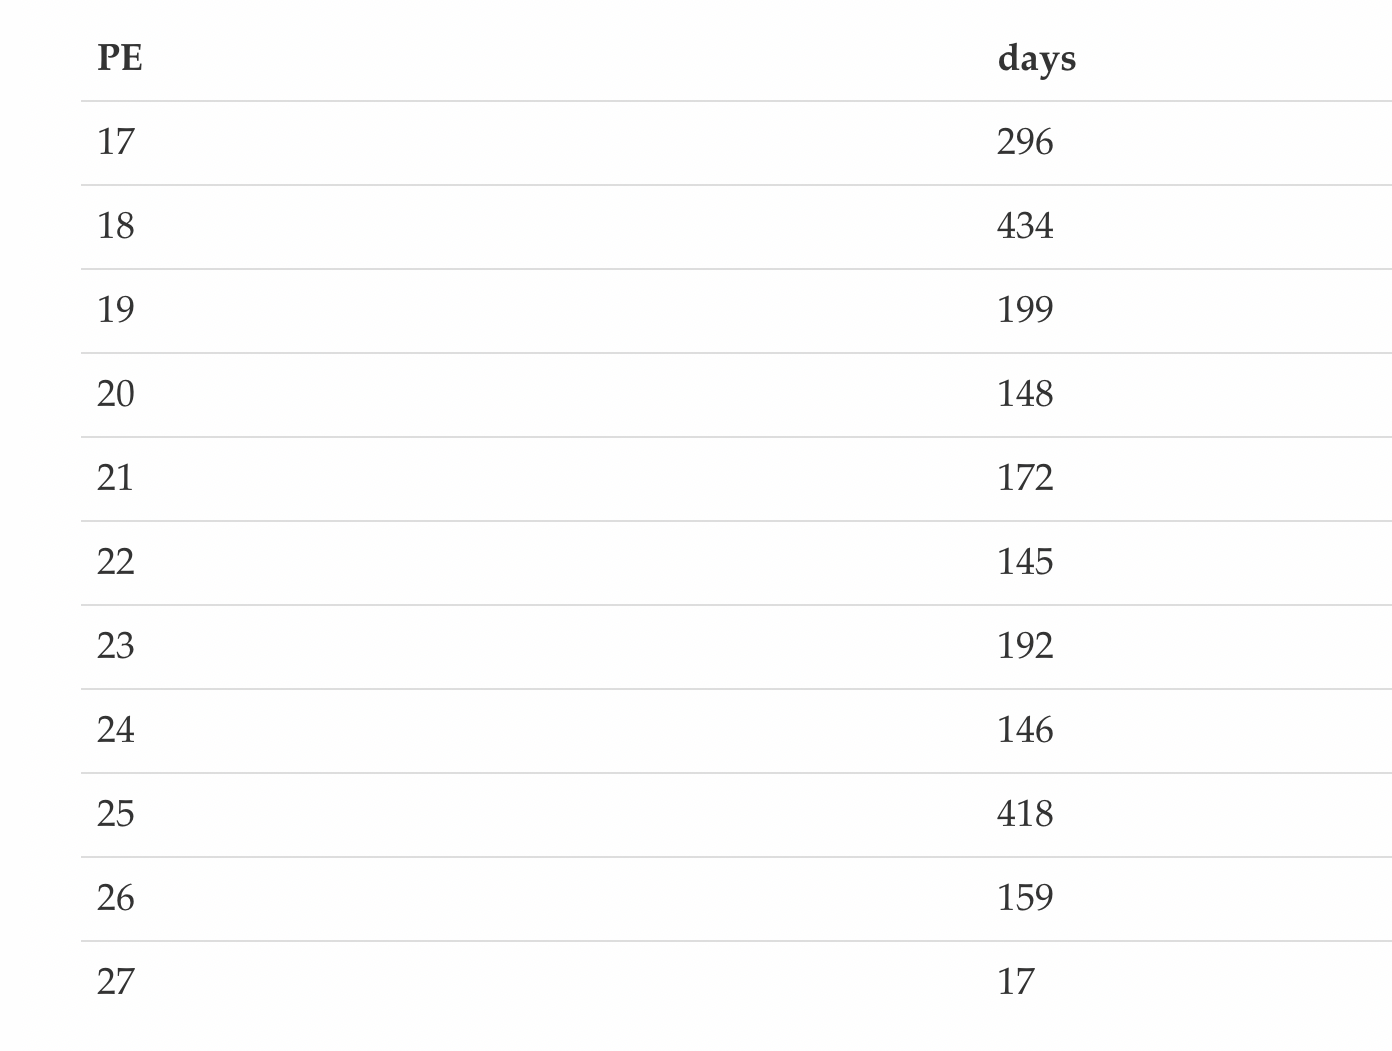
Why is Taiwan's Chunghwa Telecom's PE ratio high?
postscript
Published simultaneously on [Mirror]( https://mirror.xyz/0xeFb9cf19e57aad8b4fF4B76B584Ed95797aef11e )/[Matter]( https://matters.news/@6u3m )
For the data generation method, please see this [Do-it-yourself statistics of TSMC financial data]( https://mirror.xyz/0xeFb9cf19e57aad8b4fF4B76B584Ed95797aef11e/3Hl9LWAK6DXu3AEEwD_YsXkMjkqEwQtkic8h_M4Hsho )
All data are for reference only and cannot be guaranteed to be 100% accurate
[transaction data bar.csv]( https://github.com/6u3m/statistics-finance/raw/gh-pages/2330/20220807/bar.csv )
[Financial data quarter.csv]( https://github.com/6u3m/statistics-finance/raw/gh-pages/2330/20220807/quarter.csv )
[Daily Chart]( https://6u3m.github.io/statistics-finance/2330/20220807/daily.html )
[Monthly chart]( https://6u3m.github.io/statistics-finance/2330/20220807/monthly.html )
[Data download]( https://github.com/6u3m/statistics-finance )
Recommended Books
**[Izaax]( http://www.izaax.net/blog/)**
Circular Investment Economic Indicators Tell You & What They Don't Tell You Dow Jones 30,000 Points: The Century's Great Market Buying Books You Can't Miss => [Blog Lai-Aishek]( https://search.books.com.tw/ search/query/key/ Aishek)
It is a must-read in the general direction of the general economy. It is very difficult to understand. I read it with financial current affairs, blog questions and answers, monthly articles, and the knowledge in the book. I can already understand the content of the book, and it is a good book that can be used for a lifetime. ,highly recommended.
**Very Potential Stock - Fisher - 1958**
Common Stocks and Uncommon Profits and Other Writings
Philip A. Fisher
buy book =>
[Huanyu Caijin Network]( https://www.ipci.com.tw/index_book.php )
[Blog come - very potential stock]( https://www.books.com.tw/products/0010721407?sloc=main )
In the book published in 1958, the author of the era said that most of the investing public did not understand investing. In 2022, most people still do not understand investing. History has been repeating.
**Super performance**
Trade like a Stock Market Wizard
Mark Minervini
buy book =>
[Huanyu Caijin Network]( https://www.ipci.com.tw/index_book.php )
[BLOG COMING - SUPER PERFORMANCE]( https://www.books.com.tw/products/0010673733?sloc=main )
There are three books in total, Swing Master, and Manipulation Method is suitable for long and short-term traders.
There are many books that can be recommended. These are the first books I read when I first started researching stocks. They are particularly impressive. Novices can refer to the books of Huanyu Publishing House. Many classic books of finance and money come to Huanyu Publishing House.
@6u3m 2022–08–06
Like my work? Don't forget to support and clap, let me know that you are with me on the road of creation. Keep this enthusiasm together!
