Omplexity顾问团队参与过全球超过六十个系统图绘製的大型专案,过往的合作客户包含Google, Hitachi, 广达, Nike, 微星科技, 联合国, 世界银行及世界经济论坛等机构等客户。 创办人薛乔仁博士毕业于哈佛大学与麻省理工学院,是国际知名的系统变革专家。 http://www.omplexity.com
System Archetype - Growth and Underinvestment (Part 1)

Playing tennis with a wooden racket: A representative story of growth and underinvestment
Do you still vaguely remember picking up a tennis racket for the first time? Was that first tennis racket you rummaged through in an old warehouse, or was it given to you by a friend who no longer uses it? At the time, you weren't sure how to play tennis, much less if you liked the sport. However, you started learning tennis with that broken racket, spending time practicing several times a week, and getting familiar with the basics, even already Can hit the opponent's ball in a row. After about a month, you find that you've hit a bottleneck and can't make any progress. If you were more powerful at the time, maybe you would want to invest in the sport and get a better racket, but in the end you decided that the sport was not for you and gave up the sport.
This story is representative of the "growth and underinvestment" archetype. Under this archetype, a person or an organization is faced with opportunities and needs that exceed existing affordability. Long-term inadequacy leads to a gradual decline in performance, and the high demand or growth momentum that originally helped maintain good performance is greatly reduced. Rather than being seen as a symptom of persistent underinvestment and declining demand, declining demand or growth momentum is a reason for a person or organization not to invest further. In the end, the only correct response seems to be to stop production or find other opportunities.
Growth and underinvestment behavioral trends
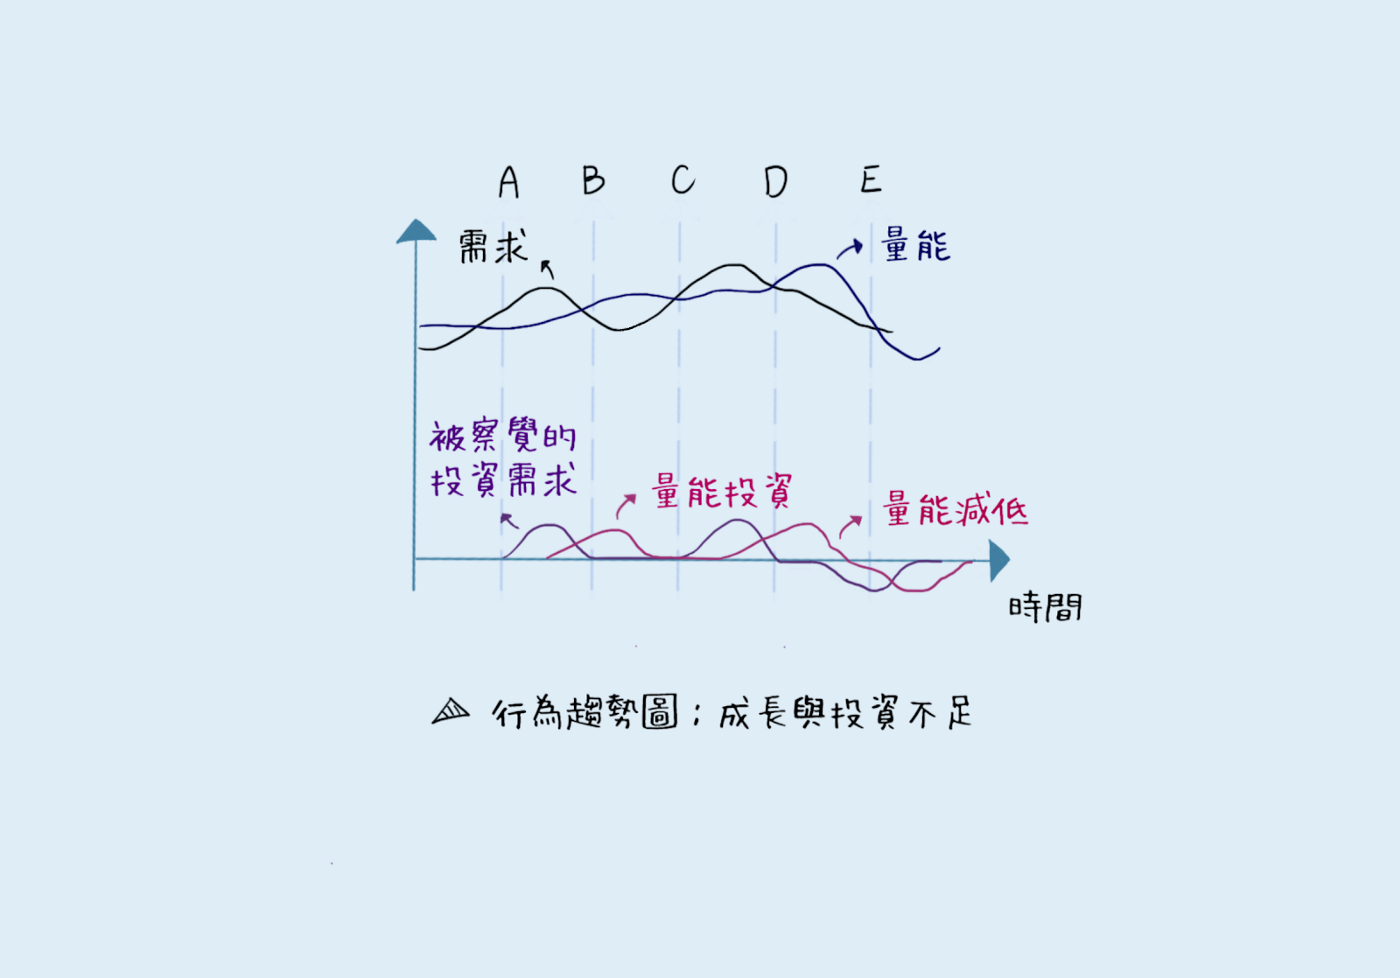
The behavioral trend graph of growth and underinvestment includes at least four variables: demand, volume energy, perceived investment demand, and volume energy investment (see Figure 1). The interactions under this architecture are tighter than in other archetypes. In particular, the perceived investment demand is the driving force for investment in energy, which in turn changes the existing energy, and the changed energy in turn affects the demand. In addition, the gap between demand and capacity also affects how much investment demand is perceived, so a loop is formed. The unrepresented growth force behind the system has many forms. It may be a stable and slow growth force driven by the implementation of policies that has nothing to do with demand, quantity and energy, or it may be only when the demand remains unchanged. The growth force of existence.
In Figure 1, there are some notable features behind the behavior of the 4-variable interaction. A time period is when demand begins to exceed capacity, and the perceived investment demand also increases gradually. After some delay (depending on the organization's situation), the investment in energy increases, and the actual energy also increases. When energy starts to exceed demand (period B), the perceived investment demand drops to 0, but because of the time delay, energy continues to exceed demand. Sufficient supply allows the company to serve consumers more casually, so demand rises again beyond its available capacity (period C), and the entire cycle above repeats.
Yet crisis lurks in these ups and downs. In today's competitive environment, not every time a company can keep up with customers by expanding its volume to meet consumer demand. When customers switch to other suppliers, the increase in demand will be smaller and smaller each time, and the company can find that it has entered the opposite situation and needs to continue to adjust the volume downward. When the D period is reached, the demand has not returned to the original quantity, and the company has to decide to reduce the existing energy to be less than the existing demand. Finally, the existing demand decreases again, which leads to the continuous reduction of energy in the future.

A Special Case of Growth Caps: Growth and Underinvested System Architectures
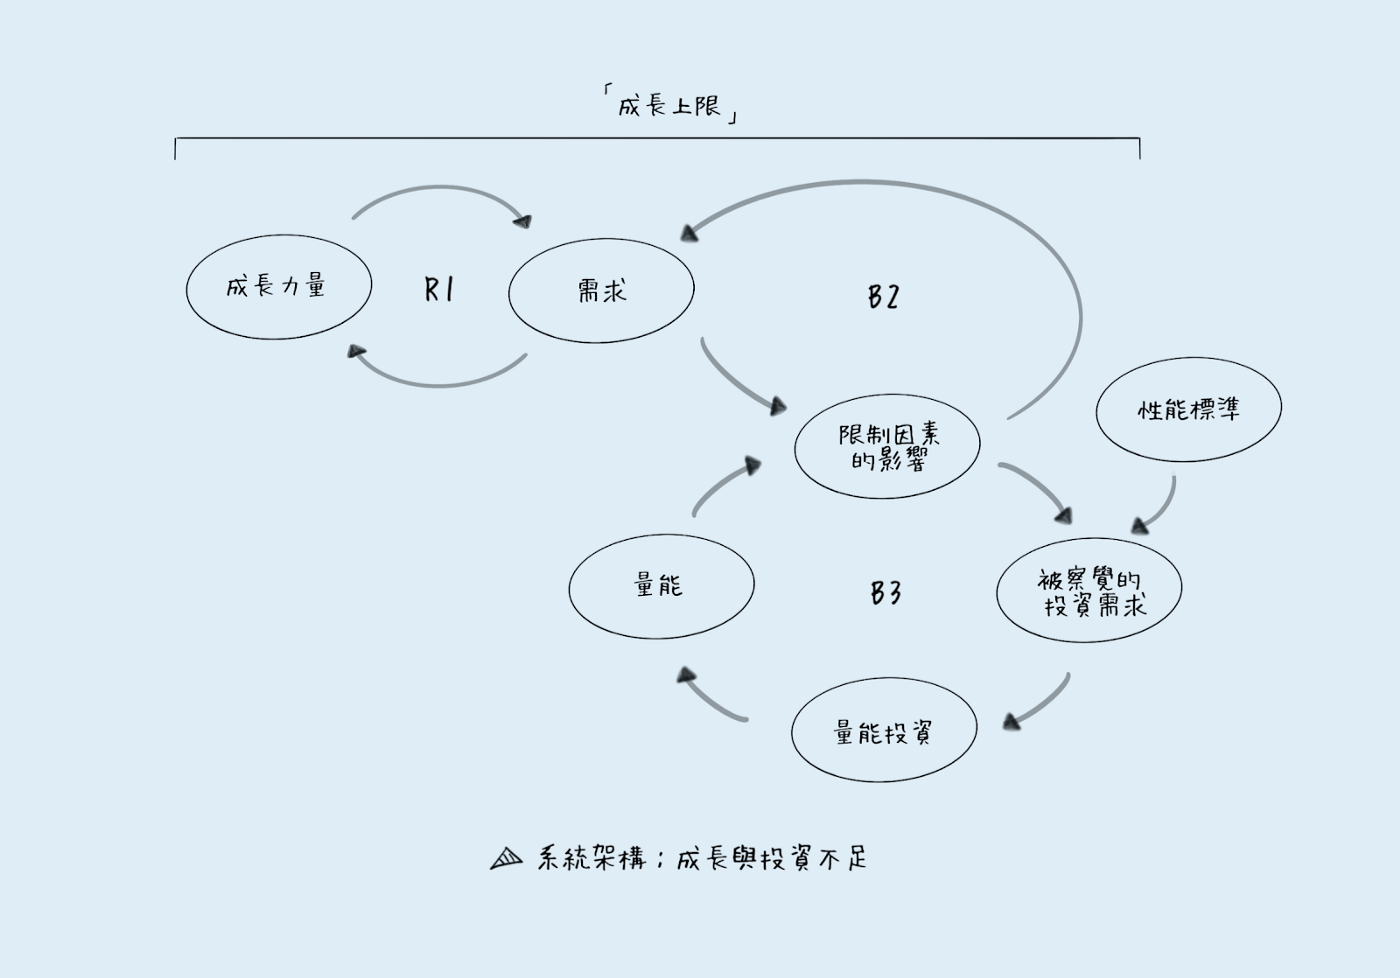
As shown in Figure 2, the causal loop diagram of growth and underinvestment is built on the framework of the Growth Cap Schema. The left side of the figure contains the two variables of growth power and demand. The enhancement loop (R1) is the growth engine of the system, and the growth brought by R1 brings pressure under the existing constraints. The influence of the limiting factors makes the originally rising The demand gradually decreases, forming a B2 balance loop. The above situation can be represented by the growth upper limit model. The key to making the growth cap schema into the growth and underinvestment schema is the B3 balancing loop that controls the limiting factor. This loop is responsible for adjusting the limiting factor to meet goals or performance criteria that people consider important. These three loops interact Actions can trigger many different behaviors.
When the impact of constraints causes existing performance to differ from the organization's performance standards, the gap between the two causes the need for energy investment to be perceived (B3). In this loop, time plays a crucial role, because in practice there is often a significant delay between when a specific energy investment is perceived and when the decision to actually increase the investment is made. When the decision is made, it will take some time until the actual volume can be increased. The increase in equivalent energy finally reduces the impact of the limiting factor, which gives B2 a force in the opposite direction, revitalizing the demand engine. We can see the architecture of this system by tracking the system feedback: when the final volume can be increased to reduce or delay the impact of the limiting factor, it will further increase the demand (B2). The rising demand increases the growth force, and the growth force stimulates the demand again, which in turn feeds back to the B2 loop (R1). The perceived investment demand is also called an increase again (B3) because the increased demand again triggers the limiting factor.
The key to this system is the operating speed of the two balance loops. If B2 is significantly faster than B3, then the increased investment in B3 cannot keep up with the real energy demand. And if B3 can react quickly, as described in the above paragraph, it will bring a reverse force to the system, the impact of the limiting factor will be removed when it actually produces a substantial negative benefit, and R1 can continue to take over the system. Get positive momentum.
As mentioned in the previous paragraphs, this archetype contains many possible actions. In one of the extreme cases, the company may fail to operate due to a large amount of low investment or too late to invest, and it is on the road to bankruptcy. In reality, we have seen several high-tech companies face this situation and have to sell departments, lay off staff, and ultimately render the organization completely inoperable. Explained in this archetype, when the impact of the limiting factor is reduced, the pressure tends to actually cause people to lower the performance standards that they originally set, rather than increasing the amount of energy invested. Thus, B2 and B3 work together to form a reinforcement loop with a latent negative effect: a continuous withdrawal of existing investments in response to a slow reduction in growth. Such dynamics make the growth engine unable to drive the system, and eventually lead the company to the tragic situation of bankruptcy (the final stage DE in Figure 1).

In this article, we mainly introduce the behavioral trends of growth and underinvestment, and use the causal loop diagram to present their structure. In the next article, we will continue to explore this archetype, using stories to lead you to better understand the operation mode of this archetype, and demonstrate how to manage this system. Interested readers can continue to follow us!
Article source: Systems Archetype Basics: From Story To Structure
If you are interested in systems thinking, please refer to our official website: Omplexity Systems Thinking Consulting Company
Like my work?
Don't forget to support or like, so I know you are with me..
Comment…