智力活动是一种生活态度 https://mountaye.github.io/blog/
.py | matplotlib notes: two APIs
The word "picture" can correspond to several words in English, picture, image, figure, plot... Among them, plot means an image showing the relationship between two or more sets of data. In trendy terms, it is the product of data visualization. The so-called matplotlib , as the name suggests, mat means a copy of MATLAB, the meaning of plot is as described above, lib means that this is a third-party library (library) of python, rather than a domain specific programming language (domain specific languange, DSL) .
The so-called API, the full name is application programming interface, is about the syntax rules of the statements that need to be written in your own code when you have your own data and want to call matplotlib to draw.
Because it is a code base, before everything starts, you need to declare the import at the beginning of your python code
import matplotlib.pyplot as plt
plt can be replaced with a name that you like and does not conflict with other codes, but these three letters are everyone's conventions.
Two APIs of matplotlib
matplotlib has two APIs, (in fact, there is a third pylab , but it has not been able to stand the test of time and is already in a state that is highly not recommended by the official), which are:
- state-based
- object-oriented
If the two styles are mixed, there is a high probability that you will not be able to play well, and various unexpected output results will be produced. The debug ability of the novice is relatively poor, so it is best to choose a side first, and then learn the remaining one when you have time.
For friends with MATLAB foundation, the state-based API syntax is almost the same as MATLAB, and you can almost get started directly. Python was a rising star back then. This trick was originally designed to attract users from MATLAB, which is quite vicious. The interface itself is relatively simple, and it is suitable for quickly viewing the results and checking errors when debugging the program.
For general beginners, the matplotlib code itself is written in the object-oriented programming paradigm. Learning this API can better understand the code, know what you are doing, and by the way, you can also familiarize yourself with the object-oriented programming paradigm. There are fewer and fewer people who know MATLAB before learning python. The example code available for copying and pasting on the Internet is increasingly using object-oriented syntax, and learning object-oriented interfaces is more practical.
Same task for both APIs

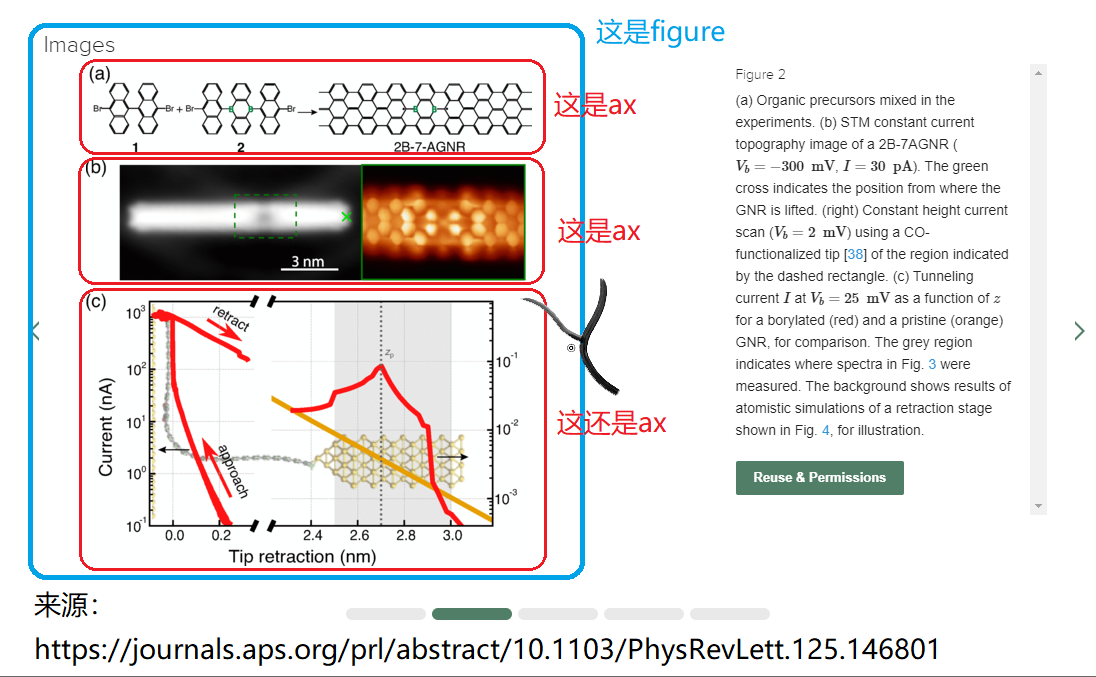
The above picture is from a paper I found on the Internet. As you can see, we usually put together several small pictures related to information. When the article is typeset, this combined picture is counted as a unit. In matplotlib, such a basic unit is called figure , and each small figure is called axis (variable name is often abbreviated as ax ). Usually a single image can be regarded as a figure with only one axis . When there are multiple images, the __getitem__() method of a tuple axes is often used to control each sub-image.

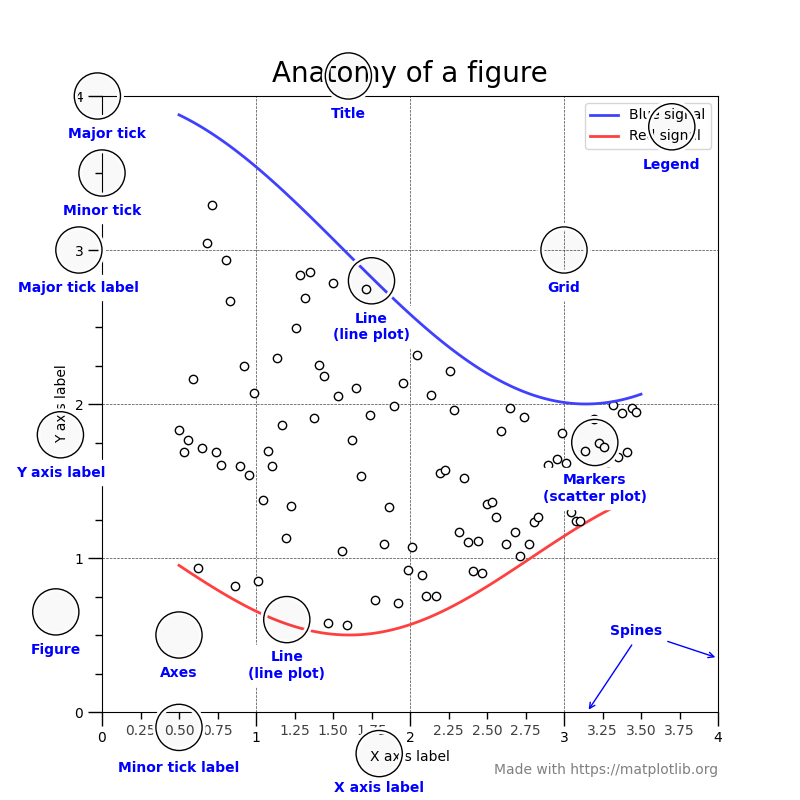
The above picture is from the official website . The blue words in the picture are the elements contained in a figure with only one axis that matplotlib thinks.
What the two APIs do is to create figure and axis , and then provide functions/methods to generate or change each element.
state-based
The so-called state-based API is not very easy to explain. As mentioned earlier, adding plt in front of each function, the rest is almost exactly the same as writing MATLAB.
Looking at the tutorial given by the official website , two interesting phenomena can be observed:
- almost no assignment operator
= - almost all
.front isplt
That is, commands related to matplotlib are functions, and the return value does not need to be assigned to any variable. The concepts of figure and axis are hidden, plt.figure() creates a figure; plt.subplot() creates multiple axes and puts the program's attention on the subplot specified by the function parameter; the following set Functions that define various elements will act on the subplot specified by the latest plt.subplot() before.
No assignment means that the return value of the function is not important. These functions will act on the state machines of figure and axis maintained in the background, which means that these functions have side effects and are not pure functions.
object-oriented
- The first few sentences will have the assignment operator
=, and the assigned variable names are generallyfigandax. -
.The front isfigandax, of whichaxis mostly.
fig and ax are instances of two objects, matplotlib.figure.Figure and matplotlib.axes.Axes respectively. Drawing and adjustment are calling the methods of the two objects, mainly the methods of ax .
DifferencesCheat Sheet
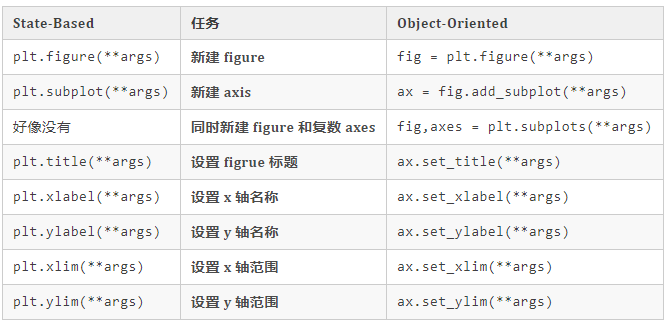
Most of the commands have the same names under the two APIs. The difference lies in whether the beginning is plt. or ax. , but a few commands are different. The following table is made for an incomplete list:

Other different commands will be updated when needed in the future.
Like my work?
Don't forget to support or like, so I know you are with me..
Comment…