書外的文學是生活 narratives-of-daily.ghost.io
One-click organize author data weekly report 2.0
This week's weekly data report (available for creators in Matt City! Click here to get your creative achievement report 🔥 Leave a message to apply, the content of the weekly report can refer to this article) in the "article data details" page, there are more "in-site exposure times", " Clicks on the site" and "Exposure_Click Conversion Rate" are three columns.

Simply put, through the data of exposure_click conversion rate , we can know whether readers want to click on the article after seeing the title, abstract, and header image of the article.
How to use the new template?
Refer to @Code Farmer's Daily Big Things-Li Code Farmer's Daily-"Establishment Article" to discuss the legitimacy of automatic clapping and the weighting method mentioned in the article (plus annoying him in Xiangte City), let the article be exposed on the site In addition to being tracked and selected as featured, the way to improve the degree can also increase the reading time of articles, increase the number of supported articles, and use the fireplace to publish articles. In addition to the exposure_click conversion rate , this template also includes data on the number of tracking, total support, and total reading time . Of course, the data is for reference, and it is personal. Like me, there is no way to put this article that has nothing to do with literature. Incorporated around the fireplace.
The graph generated by the template is as follows:
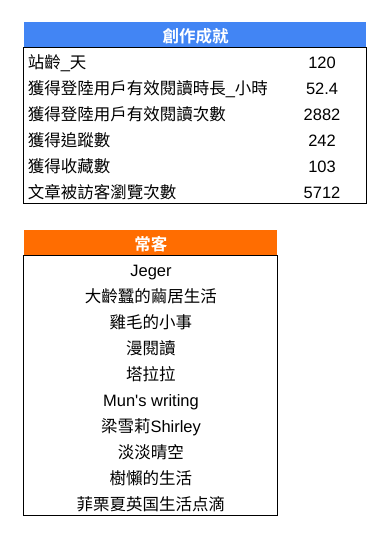
First of all, the creative achievements are similar to those of regulars and 1.0, so I won't go into details.

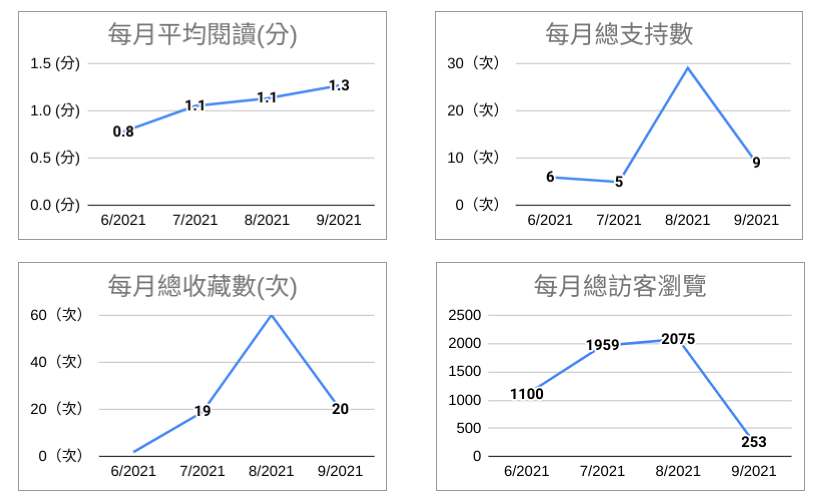
The following four charts are the monthly average reading time (minutes), the total number of supports, the total number of favorites, and the growth of the total number of visitors . Like I'm going to review support and favorites for September.

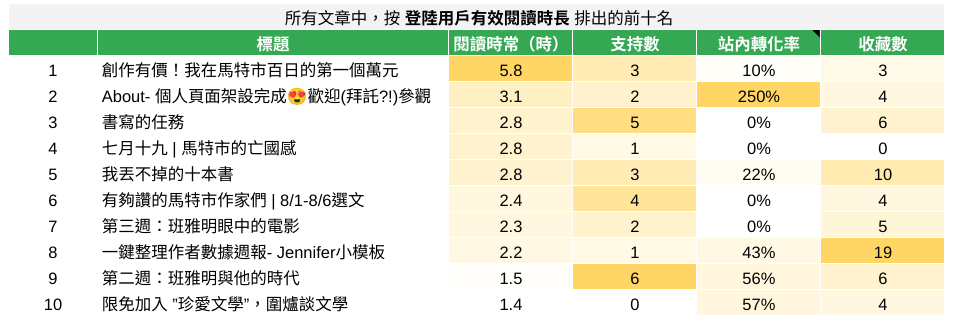
Finally, it selects the top ten of all articles according to the reading time , and then looks at the support count, on-site conversion rate (that is, exposure_click conversion rate), and favorites of each article. Special note, because the conversion rate on the site is officially the data after 9/2, but looking at the details of the article data, some articles before 9/2 also have this data, but it is definitely not allowed, and everyone will see the picture. 250% of . When my boss sees this number, he will orgasm.

Template usage steps
- Click into Jennifer Small Template 2.0 and create a copy .
- Enter the URL of the Google Sheet in the "1. Enter the URL of the data report" tab, and click " Allow access " according to the picture instructions.
- You can see the above chart in "2. Dashboard".
Like my work?
Don't forget to support or like, so I know you are with me..
Comment…