This the place I wrote something interesting.
Tony Crypto Exchange-Contract Novice Village- Trend Support Pressure Line
In the process of contract trading, it is actually making a prediction of the future market. At this time, the trend line plays a very important role.
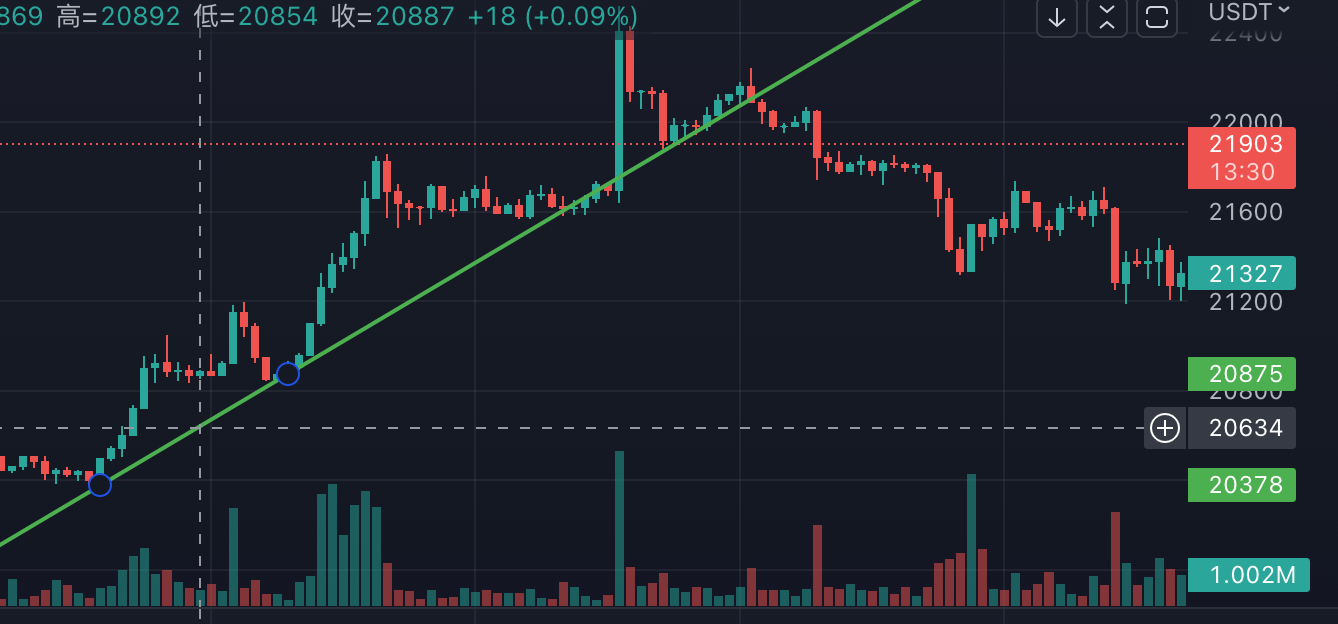
Uptrend line:
 How to draw: Connect the two closest lows to form an uptrend line extending upwards.
Purpose: After falling below the rising trend line and closing K, you can open a short position.
     Any step back to the trend line, as long as it forms support and a doji appears, is a good long position.
Supplement: After referring to MACD and KD, the direction can be preliminarily determined.
For example: when it falls, it encounters an ascending trend line. At this time, the doji is closed, the MACD is above the zero axis, the energy column is long in line, and the KD is in the oversold zone (below 20). At this time, it is a good time to buy.

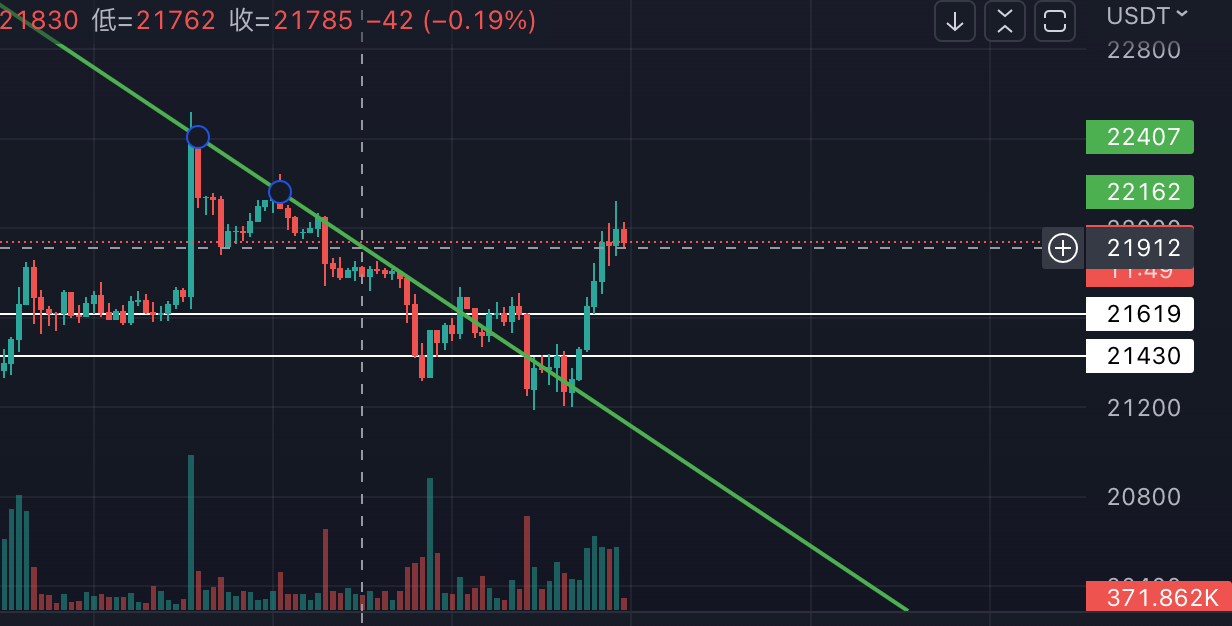
Downtrend line:
 Drawing method: Connect the two closest points on the way down to form a downtrend line.
Purpose: When breaking through the downtrend line, you can try to open a long position after receiving K to confirm, but sometimes it will test to step back, so when it just breaks through, it is recommended to buy a long position at a low price. If the breakout fails, you can try to open a short order.
Supplement: Refer to the opening points related to MACD and KD judgment.
For example: break through the downward trend upwards, MACD is above the zero axis, the energy column is long lined up, and KD is in the oversold zone (below 20), this is a good time to buy.

Support/Pressure Lines:
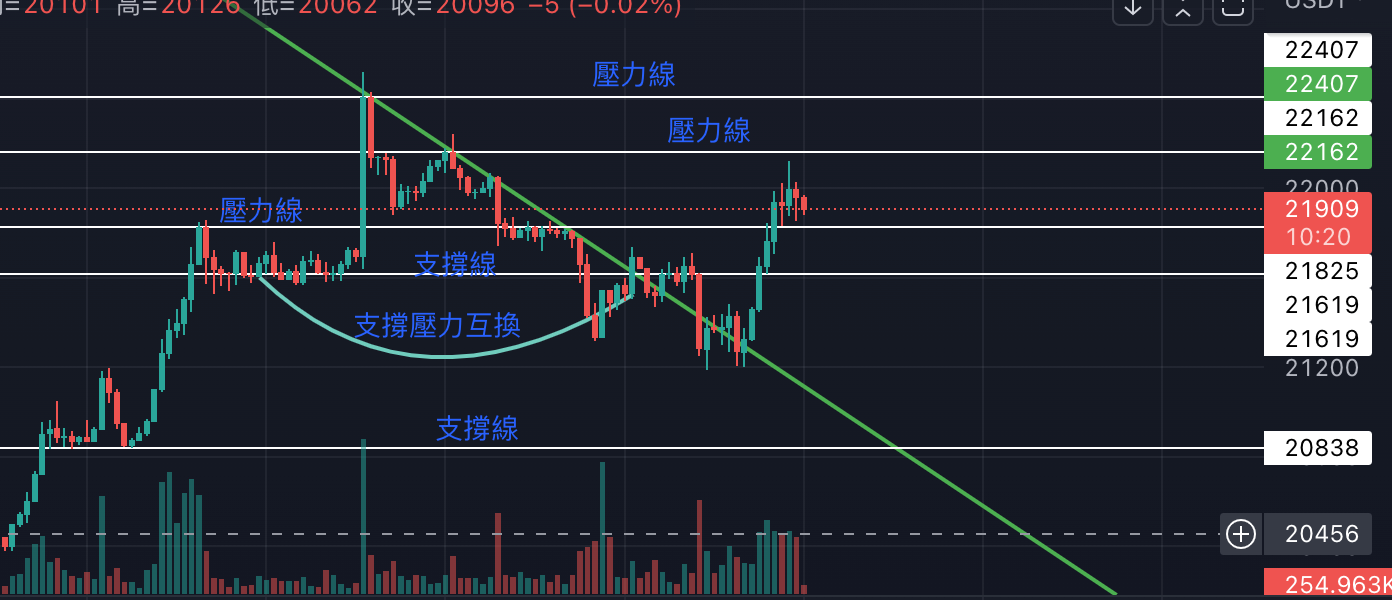
 Drawing method: look forward to the dense test points of the front wave front, and draw a support line. Go forward and look for the relative high point, where there is a chip swap (a negative bar and a positive bar), and draw the pressure level. When the price crosses the pressure line, the pressure line becomes the support line, and vice versa.
Purpose: In the rising or falling place, it is used to judge the position of take profit and stop loss.
Supplement: The support pressure exchange in the picture is a good reference. Use the dense test area on the left to draw a horizontal line to obtain a support line, and the dense area on the right becomes a pressure line. This is often the exchange of support and pressure, which is very effective.

Summarize:
Before operating the contract, be sure to actually draw these lines. In this way, in the process of operation, it is very easy to determine the price of take profit and stop loss. But it must be viewed with the MACD and KD parts, otherwise the probability of valid points is very low.
step:
- Draw a trend line first to determine the current trend.
- Find the support and pressure levels from the chip-intensive area, and look for support in the chip-intensive area during the rising process.
- Anticipate the trend and draw up the script.
- Open the plan, and design some take-profit and closing/stop-loss price levels according to the pressure and support lines.
Like my work?
Don't forget to support or like, so I know you are with me..
Comment…