Hi 我是Talf宅,將自身的生活體驗、學習、閱讀等心得,藉由文章分享出來。留給自己也給有興趣的人。
Study Notes (2) | U.S. Treasuries X Yield Inversion X Recession?
This month's online forum on the influence of global general managers held by MacroMicro Finance M square
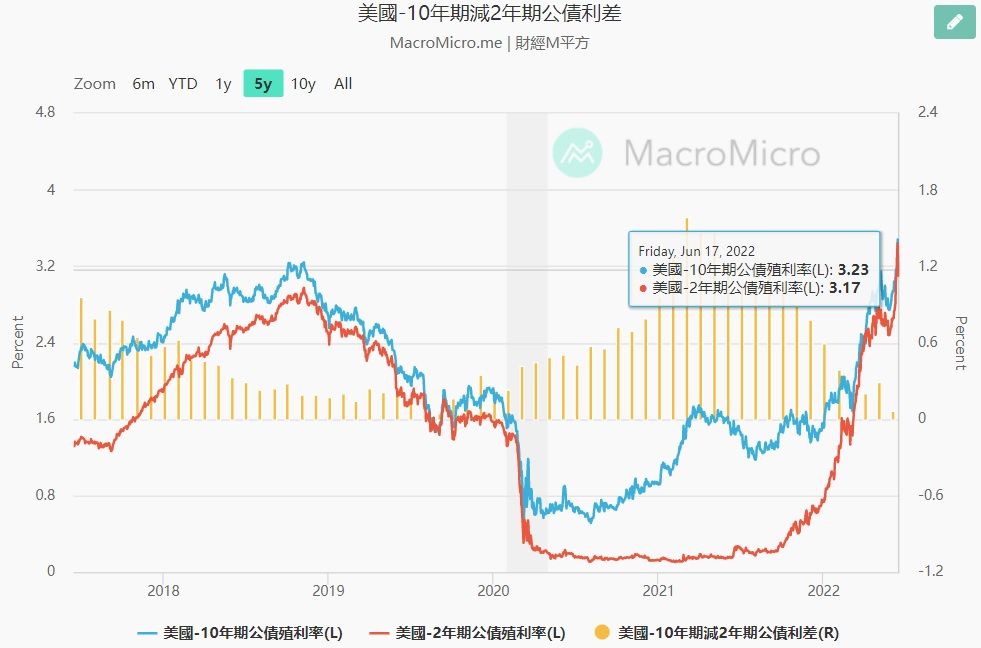
Take a look at the correlation between U.S. Treasuries, yield inversions, and the broader economy with the chart below that founder Rachel mentioned in her speech.

The following content is based on personal information and learning ideas, and is for reference only. If there is any error in the content, please correct me
💵 U.S. Treasuries
Basic knowledge:
The so-called U.S. government bonds are government bonds and government bonds issued by the U.S. government, which are collectively referred to as public bonds.
According to the maturity period of the bond, it can be divided into short (within two years), medium (within two to ten years), and long-term public bonds (more than ten years)
Generally, two- year government bonds are regarded as the representative of short-term government bonds , and ten-year government bonds are regarded as the representative of long-term government bonds .
How to see the content of the bond:
The content of a bond includes the face value (the fixed value that can be exchanged for the bond when it matures), the coupon rate (the fixed interest that the issuer will pay), the coupon date (the date the issuer will issue interest each year), Maturity date (the time until the bond matures to repay the principal, divided into short, medium and long), market value (the actual purchase cost of the bond purchaser, which is generally different from the face value).
For example: a bond with a face value of $1,000, a coupon rate of 5%, a coupon date of one year, and a maturity date of 20 years (long-term bond), the principal value of the bond is $1,000, and the interest is paid once a year. US dollar for 20 years.
On bond yields:
●The current yield rate is based on the market value of the purchase to calculate the current yield. In the above example, an investor purchases this bond with US$1,050 and pays US$50 in annual interest. Current yield = annual interest / purchase Price = 50 / 1050 = 4.76%, but this does not take into account the principal withdrawn after expiration.
●The maturity yield rate is the calculated annualized rate of return after taking the principal after maturity into account, which not only calculates the real investment rate of return from the purchase of bonds to the maturity period, and the commonly used government bond yield rate is It is based on this maturity yield rate, and the algorithm can be found on the Internet, so it will not be discussed here.
Important: The actual purchase price of bonds affects the yield rate. The higher the yield rate, the lower the bond market price . On the contrary, the lower the yield rate , the higher the bond market price. Friends have misunderstood the meaning of this yield rate, please remind me.
❗ Yields inverted
Under normal circumstances, the fixed interest paid by long-term bonds will be higher than that of short-term bonds. Therefore, under the same par value conditions, the yield rate of short-term bonds is lower than that of long-term bonds, that is, " short-low and long-high ".
The inverted yield rate means that the short-term bond yield rate is higher than the long-term bond yield rate, which means " short-term high and long-low "
What is more likely to cause an inversion of reproductive interest rates?
- Market investors are generally not optimistic about the future economy. In order to avoid risks, they tend to be conservative and transfer a large amount of funds into long-term government bonds, or from short-term government bonds to long-term government bonds, resulting in a large influx of funds into long-term government bonds, and their market prices continue to rise. Long-term yield rates have fallen. On the contrary, short-term government bond funds have been drained, market prices are low, and short-term yield rates have risen, which may cause a " short-term high and long-low" situation.
- For example, in order to combat inflation this time, under the central bank's interest rate hike policy, the interest rates of both long and short government bonds have risen, but investors are not optimistic about the future economy and have increased their holdings of long-term government bonds. However, the increase in long-term government bond purchases and the suppression of the increase in long-term yields may cause a " short-term high and long-low" situation.
- That's why it is often heard that when the reproductive interest rate is inverted, it means that the economy will enter a recession, which is not optimistic.
But according to Duke University professor Campbell Harvey , known as the " Father of the Yield Curve Indicator, " it usually takes a quarter of interest rate inversion before it can be judged that the economy is really heading for a recession.
After reading the theoretical part above, let's look at the practical part.
Quantitative Easing and Treasury Yields
Since the financial crisis in 2008, the United States carried out the first quantitative easing (QE: Quantitative easing) policy to save the market, that is, the government bought short-term government bonds with qualified traders, money market funds, government financial depository institutions, etc. to increase market funds. Liquidity, the move will significantly lower short-term Treasury yields.
According to history:
- At that time, QE bond purchases were started in December 2008, until January 2014, when the amount of bond purchases was reduced, the bond purchases were stopped in October, and the balance sheet reduction was started in October 2017 (the purchased government bonds were sold and the funds in the market were recovered).
- The epidemic has impacted the economy. Infinite QE will be implemented in March 2020, bond purchases will be reduced in November 2021, bond purchases will be stopped in March 2022, and balance sheet reduction will be started in May this year (recovering funds from the market).
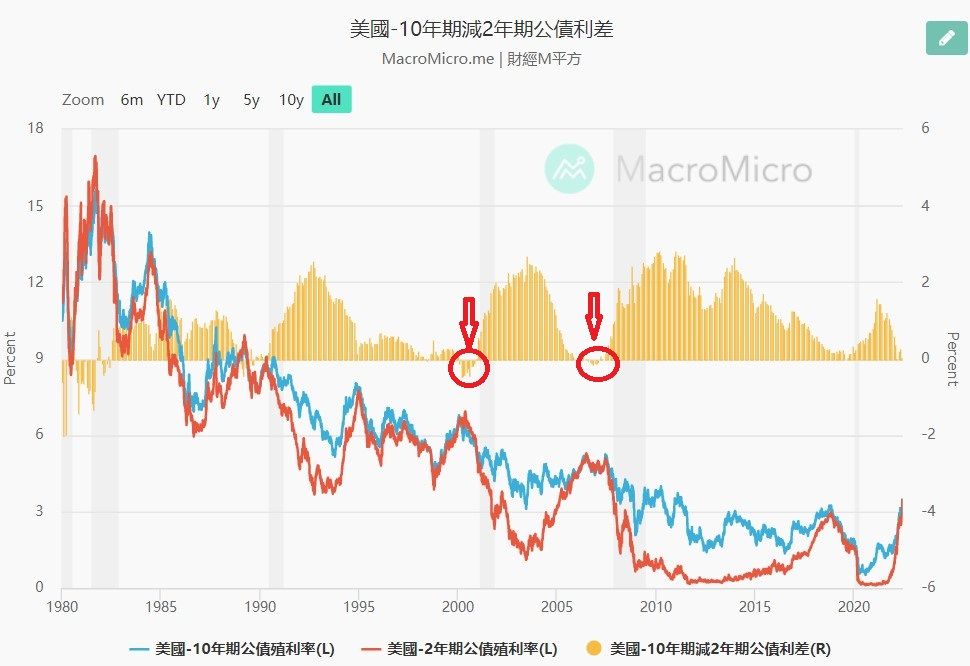
According to the historical line, since the first QE was launched to the present, after the US government stopped QE and reduced its balance sheet (short-term yields climbed), there has never been a situation where the yield rate has been inverted for more than one quarter. (See the chart below, if the yield rate is inverted, the long-term bond-short-term bond spread will be negative)

Extending the time further, historically, the yield rate has been inverted and maintained for more than one quarter, which occurred during the first one to one and a half years when the Internet bubble burst in 2001 and the financial turmoil in 2008.

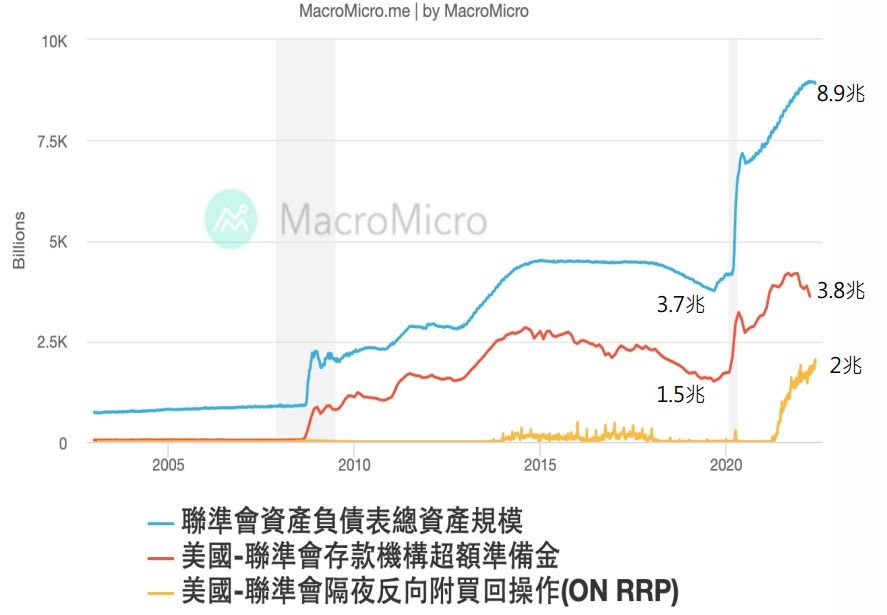
Finally, bring back the chart mentioned at the beginning of the article. The line chart represents the following description:
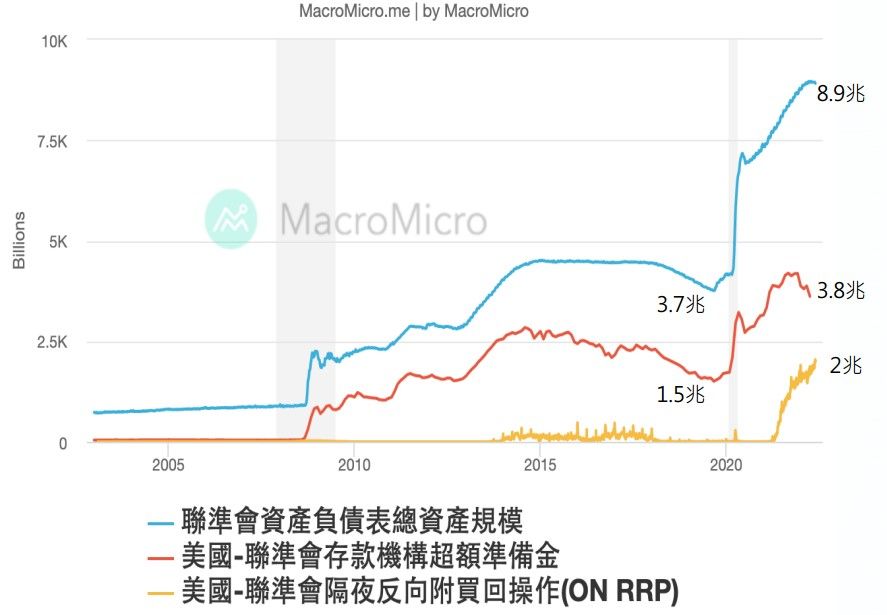
- (Blue line) Total assets on the balance sheet :
The amount that has suddenly soared since 2008 is when the Federal Reserve began to spend money to buy bonds. At that time, the amount of QE in the financial crisis reached 3.7 trillion . In 2020, the impact of the epidemic has soared to 8.9 trillion under the unlimited QE. - (Red Line) Excessive Reserves of Financial Institutions : Study Notes from the Previous Article|Inflation X Interest Rate Increase X Deposit Reserves The deposit reserve mentioned in the deposit reserve is the deposit amount received by the financial institution from the client, and it must be based on the deposit reserve ratio Deposited in the central bank, after deducting the deposit reserve, the remaining amount is the excess reserve , but this excess reserve can be used by the financial institution at its discretion, and it must be deposited in the central bank, lent out or retained by the institution. Use it.
(It's too complicated to go deeper, and it's hard for me to understand it myself) - (Yellow line) Overnight Reverse Repurchase (O/N RRP) : I can only explain this to the best of my understanding...
In response to the economic crisis, the government implemented interest rate cuts and QE policies to stimulate financial institutions to provide more liquidity to the market, and even introduced a policy of negative interest rates , but it is relatively likely to cause asset bubbles or negative impact on the development of financial institutions .
In order to keep money market interest rates above 0%, not to adopt negative interest rate policies, and to allow cash-rich financial institutions to make such money a way out, the Fed launched a policy aid in 2013, which is not only an overnight reverse attachment buy back operation .
The way it works is that Feb uses the purchased government bonds as collateral, converts them into securitization and sells them to qualified dealers, money market funds, financial institutions, etc., and buys back these securities the next day and pays some price difference as the overnight trading profits of the above-mentioned institutions. , so that these financial institutions that are rich in cash and do not know where to use it can increase market liquidity by using short-term funds. (It's a bit like changing the left hand to the right hand, and then changing the right hand to the left hand...)
In the line chart of the chart below, three projects continue to soar after 2020. What does this represent? Too much money was spilled on unlimited QE coins, so much that there were nearly 2 trillion overnight reverse repurchase operations and 3.8 trillion excess reserves, which also created a rapid V-turn in the stock market in March 2020, and the stock market in 2021 will be very good. , and one of the factors for rising inflation.

Relative to this situation, the financial bubble has not been prevented from getting bigger and bigger. The time and volume of the Fed’s shrinking of the table are coming fast and big (bubble blowers are afraid of the bubble bursting), so from the end of 2021 to the present, the stock market will show Substantial revisions and retracement shocks are completely reasonable now.
However, the high oil prices affected by the outbreak of the Ukrainian-Russian war and the continuous bottlenecks in the global supply chain have led to the high inflation in the United States hitting a 40-year high. Entering a recession like 2000 or 2008.
I am a Talf house, sharing my life experience, learning, reading and other experiences through text. Keep it for yourself and for those who are interested, thank you for reading.
Like my work?
Don't forget to support or like, so I know you are with me..
Comment…